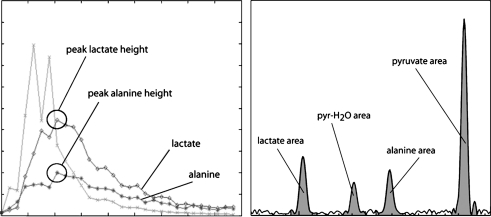
Fig. 2.
Example demonstrating the quantification procedures for slice MRS and 3D-MRSI. 13C-lactate and 13C-alanine peak heights were important parameters in the final processed dynamic curves (left). The areas of hyperpolarized 13C resonances in the 3D-MRSI spectra were used in quantitative comparisons (right). The MRS example comes from data plotted in Fig. 3, and the 3D-MRSI example comes from a voxel from Fig. 5.

