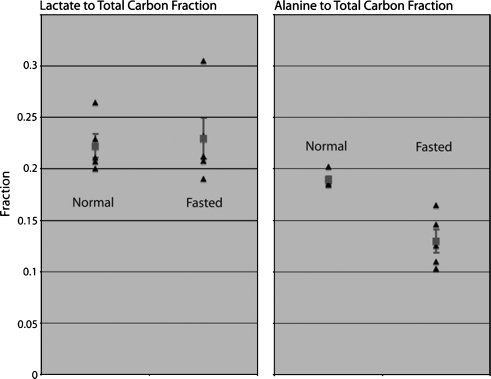
Fig. 7.
Lactate area to total carbon-13 fraction (left) and alanine area to total carbon-13 fraction (right) from 3D-MRSI studies (averaged over liver voxels per rat) of normal and fasted liver. The lactate to total carbon ratio was similar between normal and fasted groups, demonstrating that lactate levels were relatively constant. Mean/SD—(normal 0.22 ± 0.026, fasted 0.23 ± 0.045, P = 0.42). The alanine to total carbon ratio was significantly lower for fasted rat liver. Mean/SD—(normal 0.19 ± 0.008, fasted 0.13 ± 0.026, P < 0.01). Note: triangular markers show the collected data points and the square marker/error bars show the mean and standard errors. In addition, the five normal alanine to total carbon points overlap, thus obscuring some points.

