
Fig. 2.
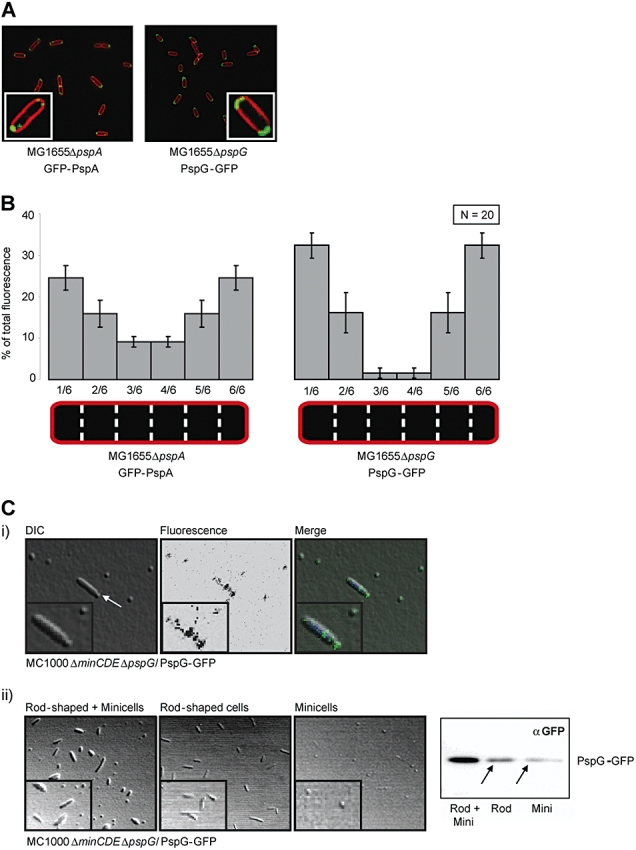
GFP–PspA and PspG–GFP localize at both cell poles. A. Epifluorescence images of E. coli MG1655ΔpspA/GFP–PspA and MG1655ΔpspG/PspG–GFP cells. Fluorescent GFP fusion proteins can be seen in green. The IM was stained with FM 5–95 (Molecular Probes; red). Images were taken using a Zeiss Axiovert 200 (inverted) microscope. B. The distribution of fluorescence intensity across six equally sized cross-segments (1/6–6/6) of 20 cells from each strain MG1655ΔpspA/GFP–PspA and MG1655ΔpspG/PspG–GFP was measured using ImageJ software. Values shown had background fluorescence substracted (measured using MG1655 cells treated with the FM 5–95 IM dye). C. E. coli MG1655ΔminCDEΔpspA/GFP–PspA and MG1655ΔminCDEΔpspG/PspG–GFP cells were (i) visualized using confocal fluorescence microscopy (the arrow indicates cell division at a misplaced division site close to one cell pole; DNA was stained using DAPI) and (ii) separated into rod-shaped and minicells (as confirmed by light microscopy), and using GFP-specific antibodies in the presence of the fusion proteins was assessed [arrows indicate PspG–GFP found in rod-shaped (Rod) and minicells (Mini)]. The results shown refer to MG1655ΔminCDEΔpspG/PspG–GFP.