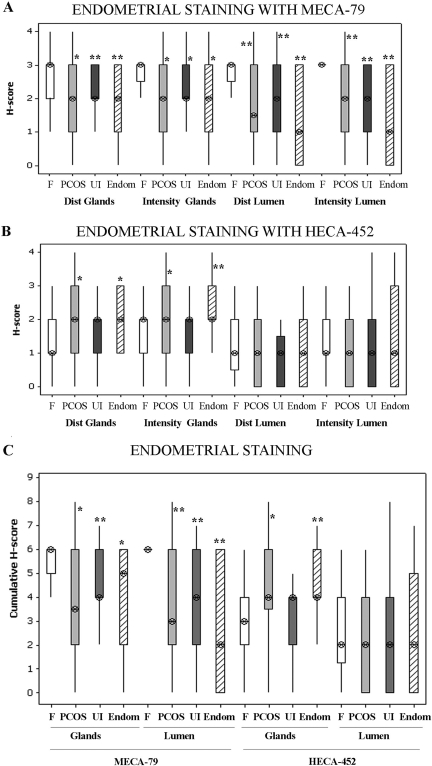
Figure 3.
MECA-79 and HECA-452 expression, intensity and distribution of staining in lumen and glands.
(A) and (B) Intensity and distribution scores for staining of HECA and MECA antibodies in endometrium of fertile and study groups are plotted. (C) Cumulative scores for each antibody and groups are plotted. Values are median (⊗) and inter-quartile range (box and whisker). The Kruskal–Wallis test followed by a Mann–Whitney test was performed to determine first statistical significance between groups and secondly to compare specific group pairs. *P ≤ 0.05 and **P ≤ 0.01 are considered significant and are compared with fertile patients. Fertile (white box, n= 33 patients), PCOS (grey box, n = 26 patients), UI (Dark grey box, n = 33 patients), Endometriosis (Endom, hatched box, n = 25 patients).

