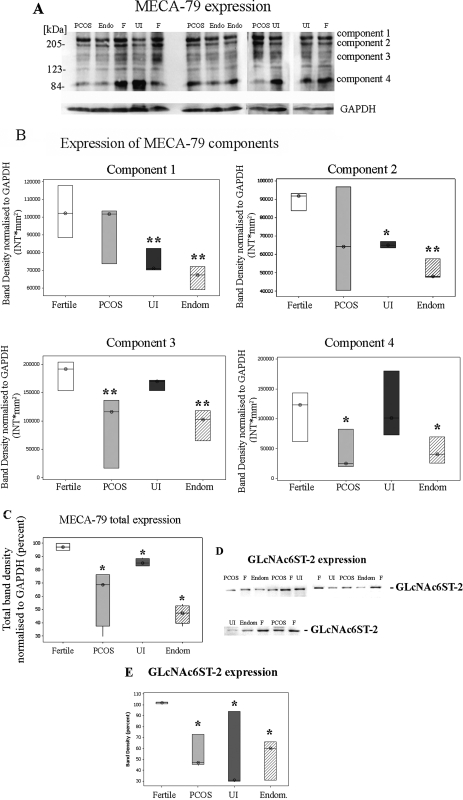
Figure 5.
Expression of MECA-79 and sulfotransferase (GlcNAc-GST2) in epithelial cells isolated from endometrial biopsies.
(A) and (D) Protein extracts of epithelial cells isolated from biopsies obtained from fertile (F, n = 6), endometriosis (Endom or Endo, n = 6), PCOS (n = 6) and UI (n = 6) patients were analyzed for the expression of MECA-79 (A) and GlcNAc-GST2 (D) as described in Materials and Methods. Protein levels were normalized to GAPDH protein levels (A). In fertile (F) women MECA-79 as well as GlcNAc-GST2 was strongly expressed compared with endometriosis (endom.), PCOS and UI. Representative blots are showed. (B) Densitometric analysis of each MECA-79 component was performed using the Quantity One software (Bio-Rad). Values are band density normalized to GAPDH and are expressed as intensity per square milimiters (INT*mm2). Values are expressed as median (⊗) and inter-quartile range (box and whisker). Fertile (white box), PCOS (grey box), UI (Dark grey box), Endometriosis (Endom, hatched box). (C) Densitometric analysis of the area covering all MECA-79 components was perfomed using the Quantity One software (Bio-Rad). Values are band density normalized to GAPDH and expressed as Intensity per square milimiters (INT*mm2). Values as expressed as median (⊗) and inter-quartile range (box and whisker). Fertile (white box), PCOS (grey box), UI (Dark grey box), Endometriosis (Endom, hatched box). (E) Densitometry analysis of the immunoblots GlcNAc-GST2 levels was performed using the Quantity One software (Bio-Rad). Values obtained are expressed as band density compared with fertile patients and are expressed as percent. Values are median (⊗) and inter-quartile range (box and whisker). Fertile (white box), PCOS (grey box), UI (Dark grey box), Endometriosis (Endom, hatched box). Statistical analysis of the samples (B, C and E) was performed using the Kruskal–Wallis test to determine significance between groups followed by a Mann–Whitney test to compare specific group pairs. *P ≤ 0.05 and **P ≤ 0.01 are considered significant.

