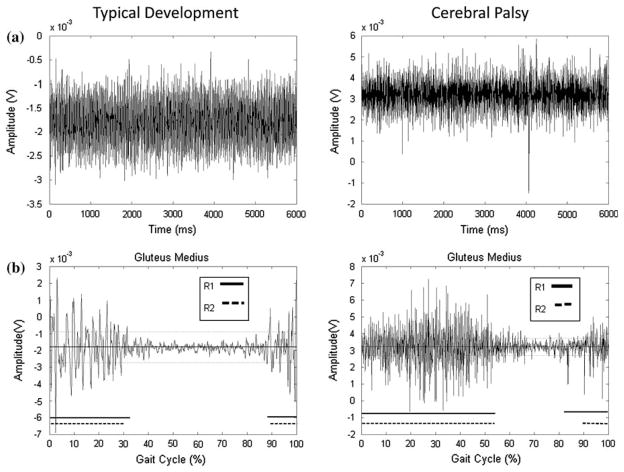
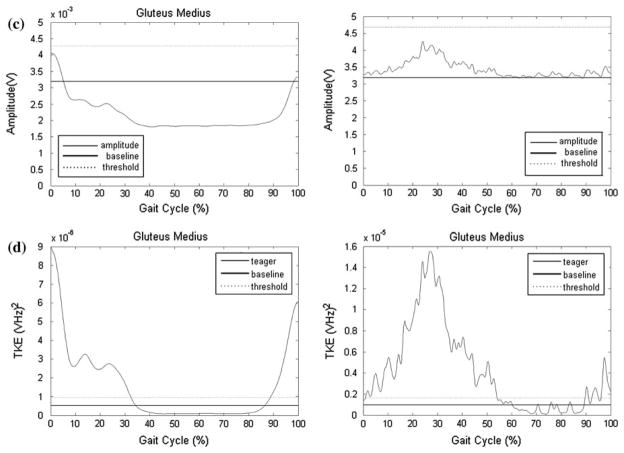
FIGURE 1.
Representative data for the gluteus medius for one child with typical development (TD) and one with cerebral palsy (CP); (a) Raw EMG traces of the static baseline trial; (b) Raw signals during walking used by raters for visual assessment. Thick solid and dashed lines parallel to x-axis represent muscle activation as determined by R1 and R2, respectively. Percent activation was determined to be 44 and 41% by R1 and R2, respectively, for the child with TD and 72 and 63% for the child with CP; (c) SD amplitude curve. The dashed lines indicate the threshold level determined from comparison to the baseline EMG. All activity above the threshold was considered “on,” which resulted in 0% activation for both children; (d) TKE curves. The dashed lines indicate the threshold level determined from comparison to the baseline EMG. All activity above the threshold was considered “on,” which resulted in 43.5% activation for the child with TD and 61.2% for the child with CP.


