
Figure 3.
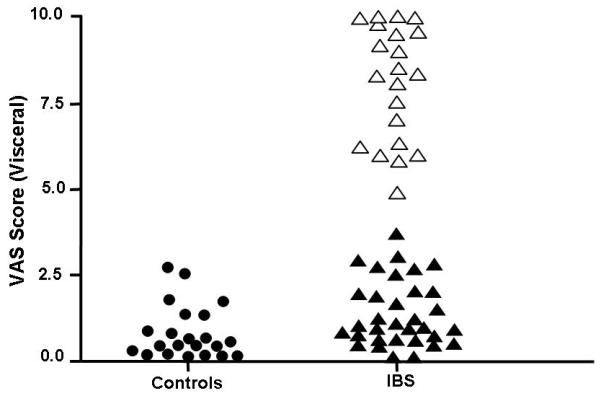
Frequency distribution of VAS score for visceral sensitivity in controls and IBS patients. Black circles represent the controls. IBS patients with a lactulose / mannitol ratio in the normal range are illustrated with black filled triangles. Empty triangles represent IBS patients with a lactulose / mannitol ratio that is elevated.