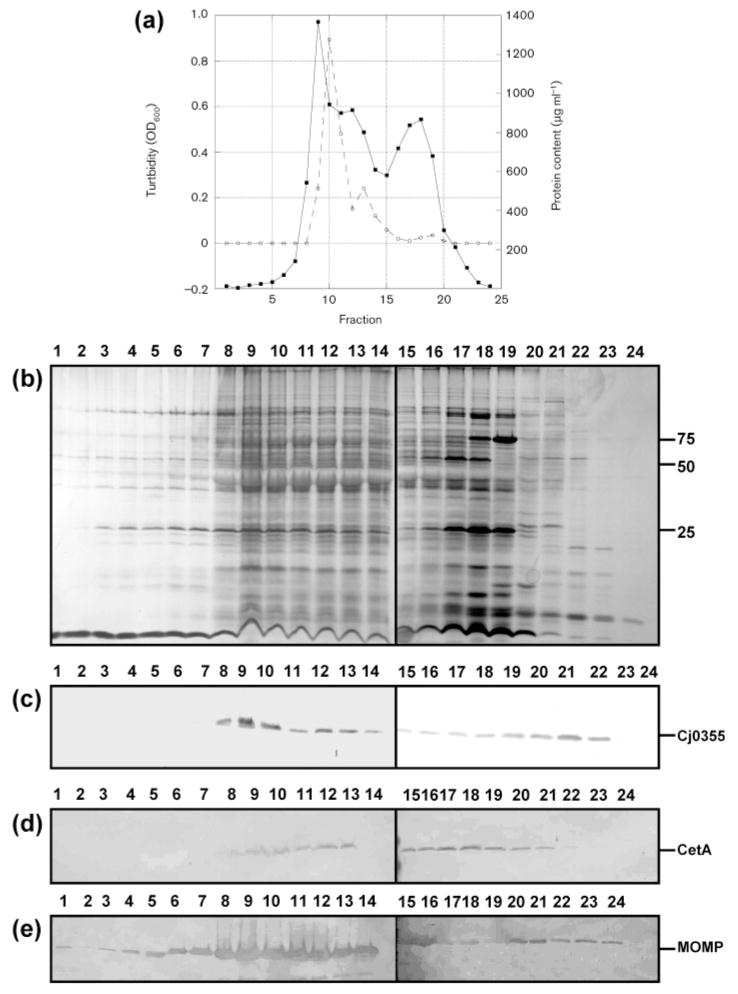
Fig. 2.
Analysis of fractions obtained from the sucrose gradient of C. jejuni strain 81–176. (a) Graphical representation of the turbidity measured as OD600 (solid line) and protein content measured by BCA assay (dashed line) for fractions 1–24. (b) Silver-stained SDS-PAGE gel of sucrose gradient fractions. Lanes 1–24, fractions 1–24 (10 μl). Molecular masses are indicated on the right (in kDa). (c–e) Immunoblots of sucrose gradient fractions 1–24 using the cytoplasmic marker anti-Cj0355 (c), the inner-membrane marker anti-CetA (d) and the outer-membrane marker anti-MOMP (e). All antibodies were used at 1: 1000 dilution. Loading for panels (c)–(e) is the same as for panel (b).

