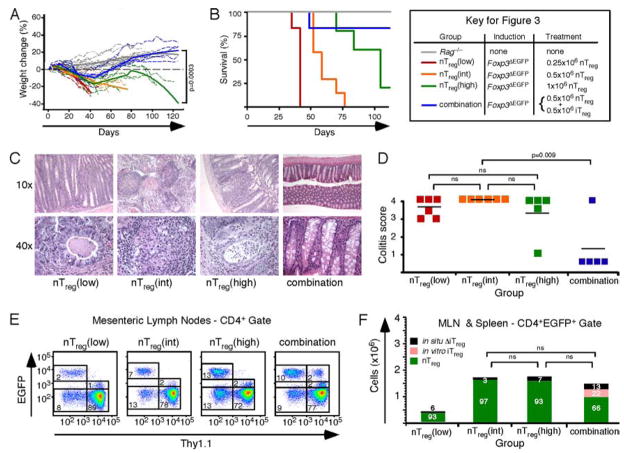
FIGURE 3.
Treatment of colitis in the absence of in situ-derived iTreg cells. A, Weight change following colitis induced by adoptive transfer of 4 × 10⁵ CD4+EGFP− Thy1.1+CD45RBhigh T cells isolated from Foxp3ΔEGFP mice. After 5–7% weight loss, recipients were treated by i.p. injection of 0.25 × 10⁶ Thy1.2+EGFP+ nTreg cells (red; n = 6), by 0.5 × 10⁶ Thy1.2+EGFP+ nTreg cells (orange; n = 6), by 1 × 10⁶ Thy1.2+EGFP+ nTreg cells (green; n = 5), or by a mixture of 0.5 × 10⁶ Thy1.1+ iTreg and 0.5 × 10⁶ Thy1.2+nTreg cells (blue; n = 5). Color-matched solid lines represent the polynomial fit based on a random coefficient regression model. B, Kaplan-Meier survival curves for the mice in A. C, Representative histological sections from the colons of the mice in A stained with H&E. D, Scatter plots depicting the colitis scores for each group. E, Representative flow cytometry analysis of the mesenteric lymph nodes from mice treated with nTreg cells (left panels) or a mixture of both cell types (right panel). Numbers denote mean values for the quadrant or gate. F, Bar graphs depicting the total number of Treg cells found in the mesenteric lymph nodes and spleens of treated mice. The proportion of nonfunctional in situ-derived ΔiTreg cells (black), nTreg cells (green), and in vitro-derived iTreg cells (pink) is indicated. ns, Not significant).

