
Figure 2. Transmission Electron Microscopy.
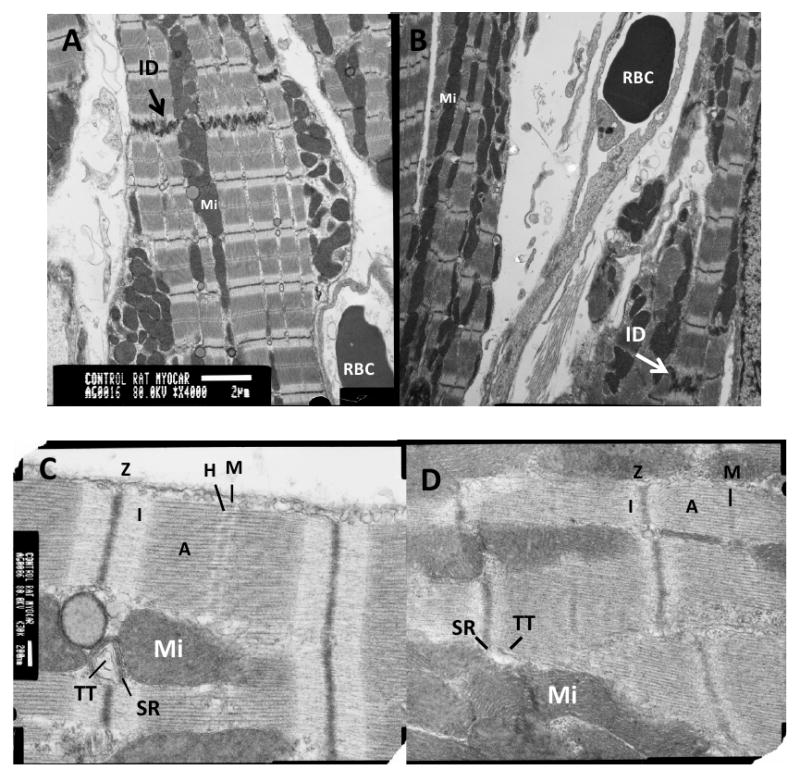
Images of sham (A, C) and graft (B, D) myocardial tissue at equivalent magnification (scale bar in A = 2 μm; in B = 200 nm). Arrows in A and B indicate intercalated discs (ID). Images of tissue in C and D show M-lines (M), I bands (I), A bands (A), Z discs (Z), H zone (H), mitochondria (Mi), sarcoplasmic reticulum (SR), and T-tubules (TT). The graft cells show mature cardiac structure except for Z-disk misalignment.