
Figure 4. Ca2+ activated force.
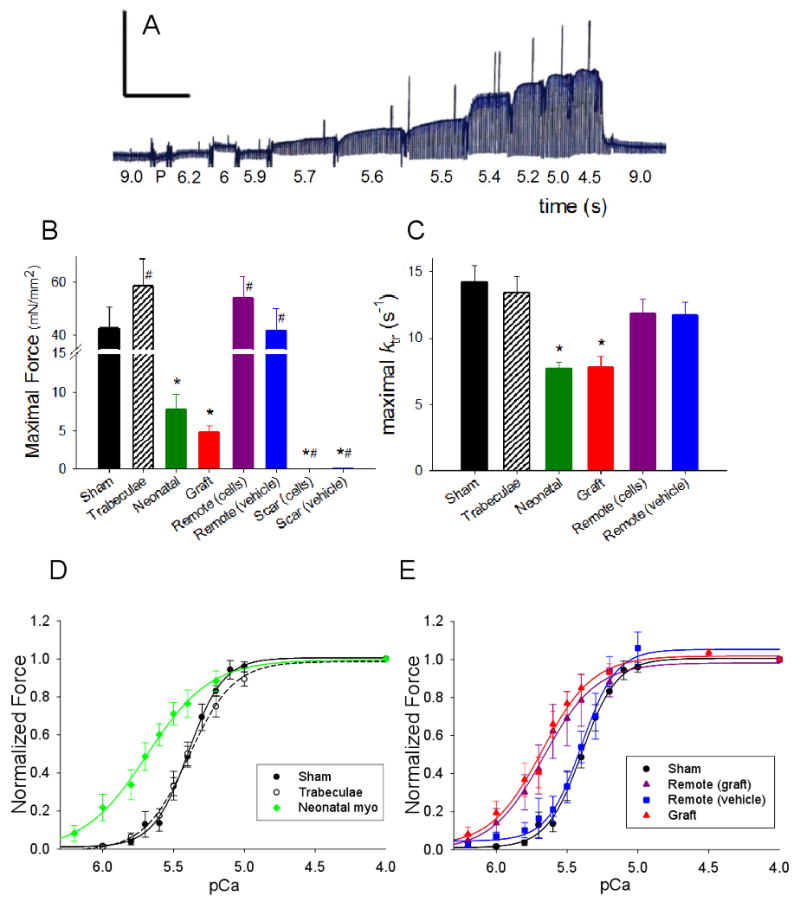
(A). Example record of force-pCa protocol. [Ca2+] was varied as indicated and isometric force was measured at steady-st, ate. For this example sham strip Fmax = 48.4 mN/mm2, pCa50 = 5.41 ± 0.01, nH = 3.2 ± 0.1 and the muscle dimensions were 1.5 mm (length) and 256 μm (width/thickness). Scale bar: 48 mN/mm2 (y-axis) and 150 s (x-axis). Summary bar plots of Fmax (B) and ktr (C) for all groups. Summary force-pCa data of controls (D) and grafted and non-treated infarcted (E) groups. Sham data are shown in D and E for comparison with experimental strips. Values are means ± S.E.M. (see Table 1 for all values)