
Figure 5. Protein Profiling.
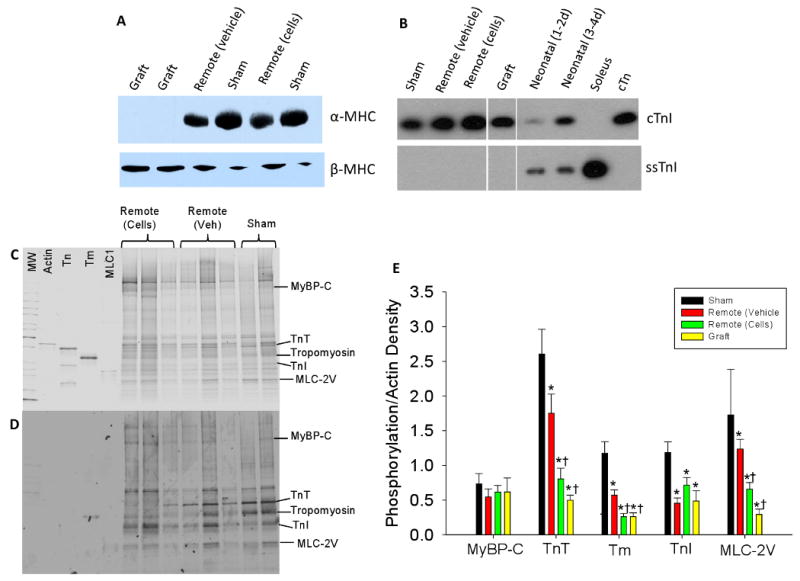
Representative western blot for α-MHC and β-MHC (A) and cTnI and ssTnI (B). C) Gray-scaled coomassie blue total protein stain and D). Pro-Q-diamond stain against phosphoproteins from sham hearts, remote tissue from grafted hearts (+) and remote tissue from non-treated infarcted hearts (-). Gel contains molecular weight markers (MW), and purified proteins actin, troponin complex (Tn), tropomyosin (Tm), and MLC1 for orientation. D) Quantification of phosphoprotein staining for all groups normalized for protein load (actin density) and to sham-operated myocardium. * p < 0.05 versus sham and † p < 0.05 versus remote (vehicle).