
Figure 6. Passive mechanics.
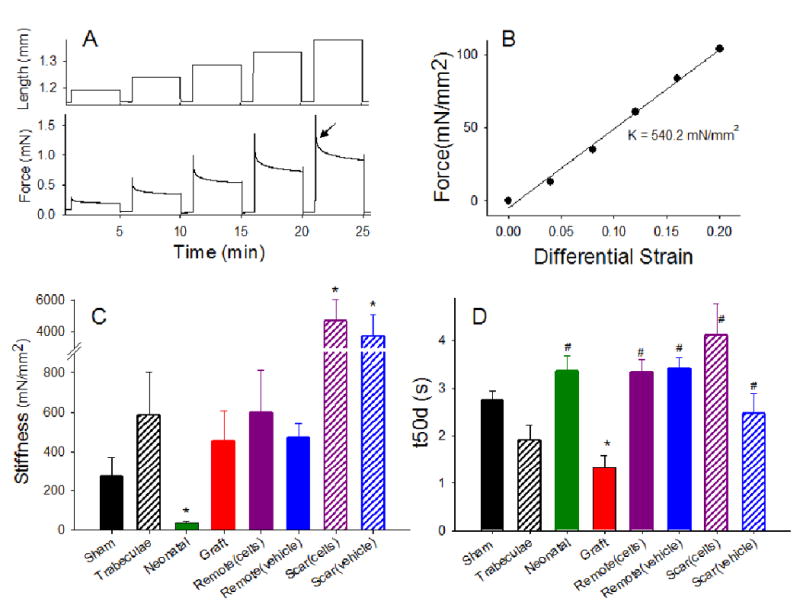
A) Example length and passive force trace of a strip to determine the stress-strain relation. Arrow indicates force after 50% decay. The strip is stretched from L0 in 4% increments up to 1.20 L0. Each length is held for 4 min, followed by 1 min rest. The stiffness constant is then calculated as the slope of the maximal passive force vs. differential strain (DS) relation (B). Stiffness constant (C) and time after 50% force decay (t50d) (D) of strips from all study groups (see Table 1 for values). Values are means ± S.E.M. In C,* p < 0.05 versus sham or graft. In D, * p < 0.05 versus sham and # p < 0.05 versus graft.