
Figure 7. Quantification of collagen content.
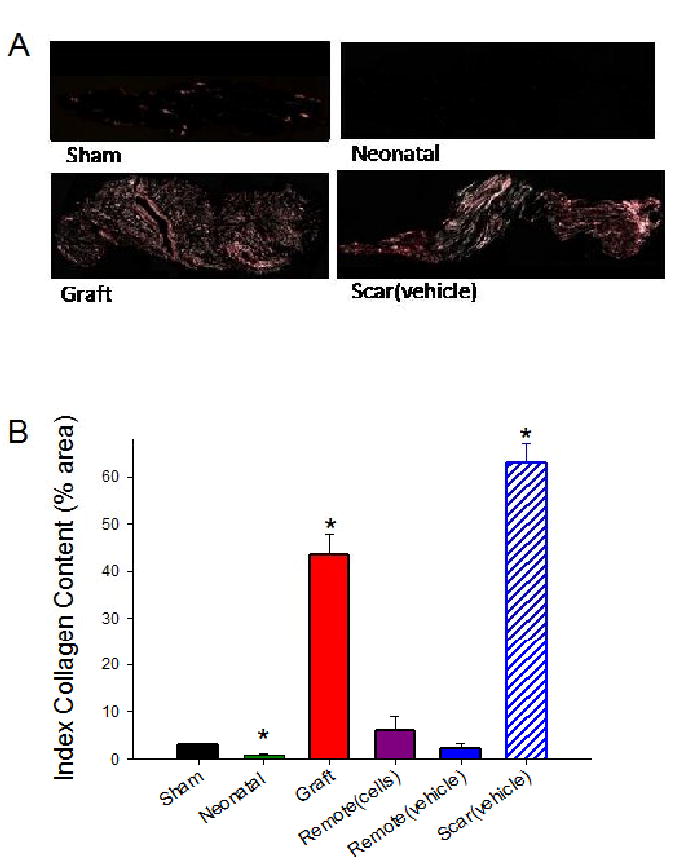
A) Example images of sham, neonatal, scar, and graft strips stained with picrosirius red/fast green and viewed under linear polarized light. Note the clear differences in the percent area positive for collagen (pink) are observed. Magnification 10×. B) Quantification of the % area in the strips positive for collagen (see Table 1 for values). Values are means ± S.E.M; * p < 0.05 versus sham.