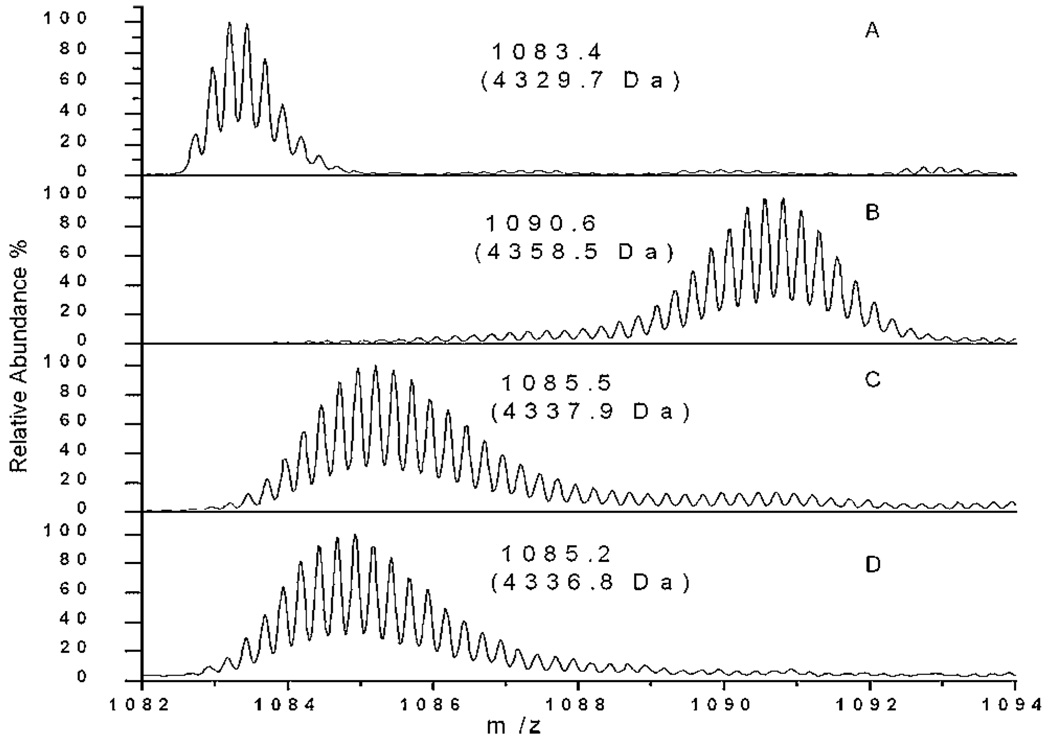
Figure 1.
Representative control Aβ mass spectra. (A) Unlabeled, freshly diluted Aβ; (B) completely labeled, freshly diluted Aβ in 90% D2O; (C) 24 h labeling of Aβ centrifuged 6-day fibril samples; (D) 24 h labeling of centrifuged 72 h Aβ samples (see Results Section). For details of centrifugation, see Aβ Sample Preparation Section. Only the most intense charge state (+4) is shown in zoom scan. The centroid molecular mass is shown in parentheses for each spectrum. Each spectrum is normalized to its own maximum intensity.

