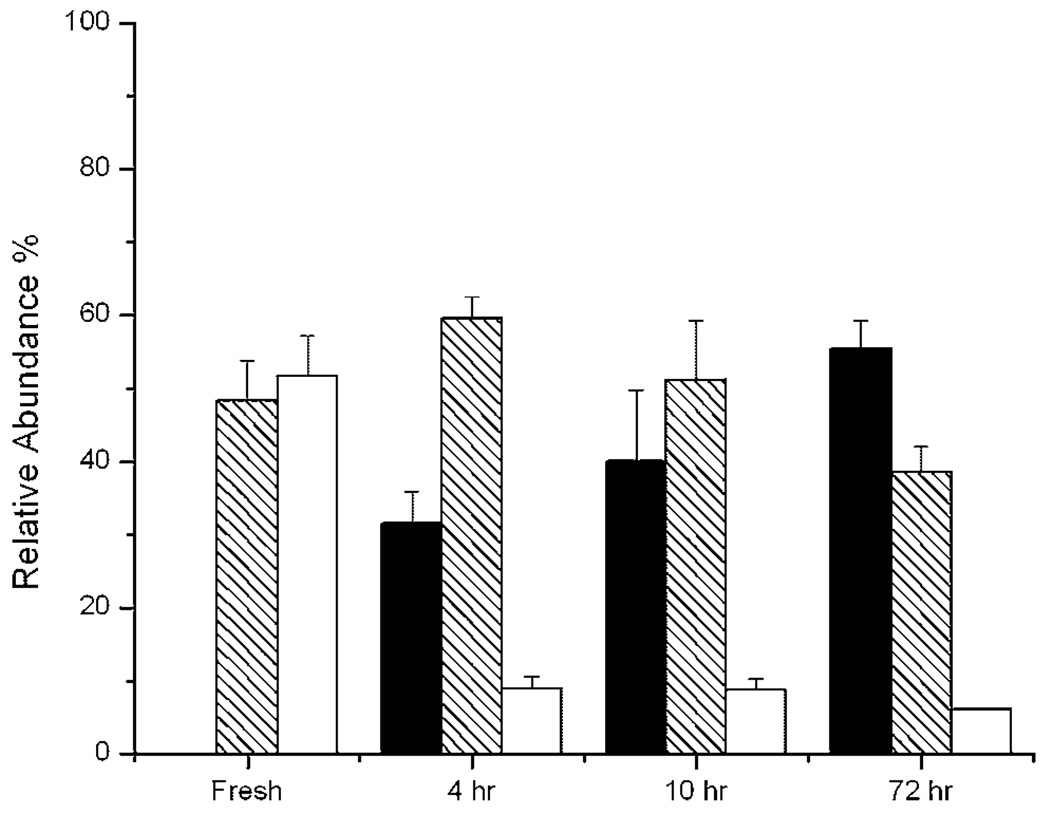
Figure 10.
Relative abundance of Aβ oligomeric components in fresh and aged Aβ samples determined by hydrogen exchange mass spectrometry after 10 s labeling. For the fresh sample, the shaded bar is the low molecular weight oligomer (m/z∼ 1087.0), and open bar is the monomer (m/z∼ 1090.5). For aged samples, filled bars are fibril (m/z∼ 1083.7), shaded bars are intermediates (m/z∼ 1086.2), and open bars are monomer (m/z∼ 1090.0). The abundance of each species was fitted and calculated as described in Quantitative Analysis of Labeling Distributions Section.

