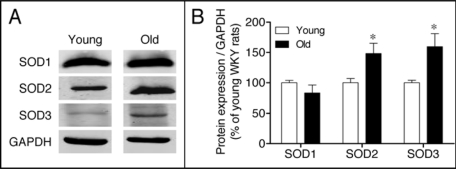
Figure 4.
(A) Expression of superoxide dismutase isoenzymes SOD1, SOD2 and SOD3 in the renal cortex of young and old WKY rats. (B) The bar graph shows a summary of densitometric data. Values are normalized to the level of GAPDH expression in each condition and expressed as % of young rats. Each column represents the mean ± SEM of four independent immunoblots. Significantly different from values in young rats (*p < 0.05) using the Newman-Keuls test.

