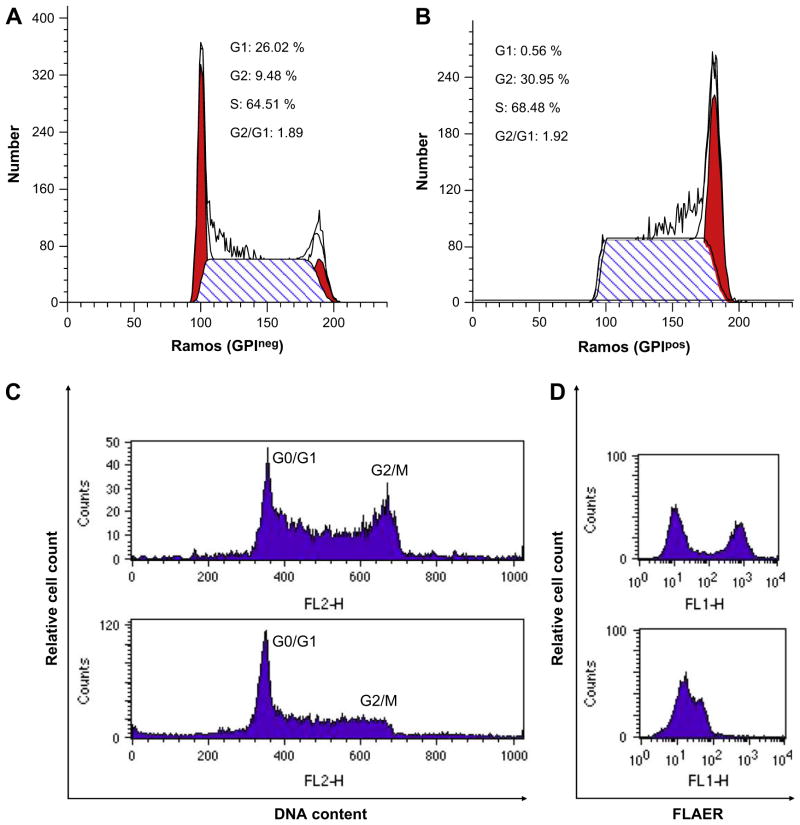
Figure 4.
Cell-cycle analysis of Ramos cells. Ramos cells were sorted by flow cytometry into FLAERneg and FLAERpos cells. Cell-cycle analysis was performed on Ramos FLAERneg cells (A) and FLAERpos cells (B). The percentage of cells in each stage of the cell cycle was calculated using the ModFIT software. Left red peak G0/G1, right red peak G2/M. (C) Cell-cycle analysis of Ramos cells before (upper panel) and after (lower panel) synchronization into G1/S with aphidicolin. (D) FLAER staining of Ramos cells before (upper panel) and after (lower panel) aphidicolin incubation.

