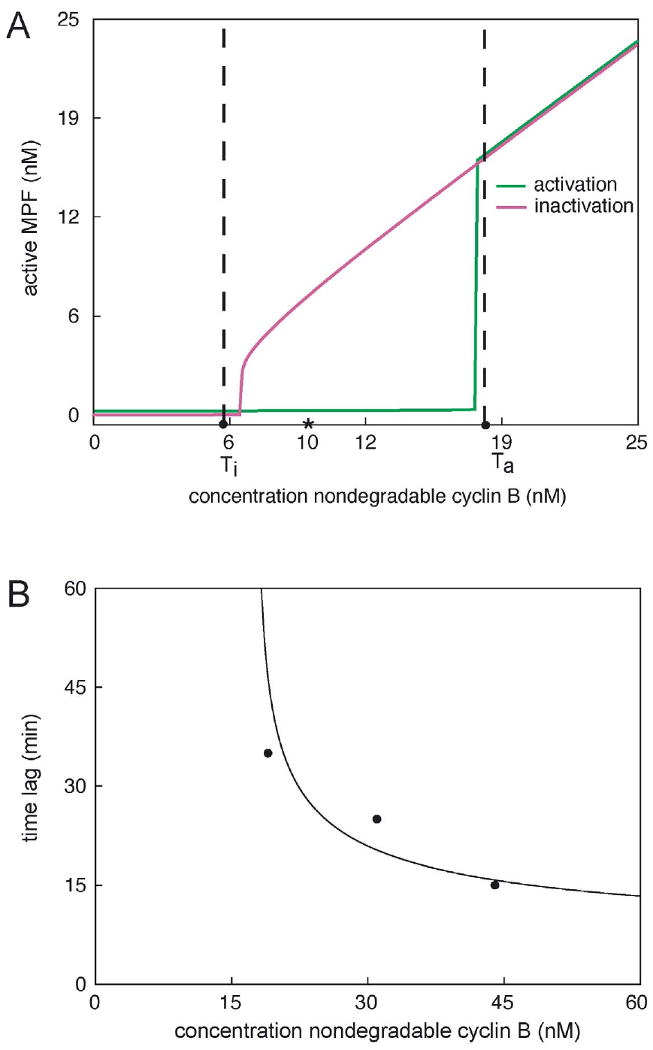
Figure 3. Hysteresis and critical slowing down in the MPF control system.

(A) Unpublished data of J. Moore indicate a cyclin between 15 and 20 nM (set at 18 nM in this figure) and a cyclin threshold (Ti) for MPF inactivation between 5 and 7 nM (set at 6 nM here). Moore's extracts showed definitive bistability (stable interphase or M-phase states) at 10 nM cyclin B (asterisk). The theoretical MPF-response curves (red and green lines) were simulated by the model in Table 2 and the parameter set Bfinal in Table 3. (B) Moore (unpublished) also observed increasing time lags (data points) for entry into mitosis (nuclear envelope breakdown) for cyclin B concentrations slightly above Ta. The simulated lag times (solid line) were computed from the full model and the final parameter set.
