
Figure 4. Rates of phosphorylation and dephosphorylation of Cdc25.
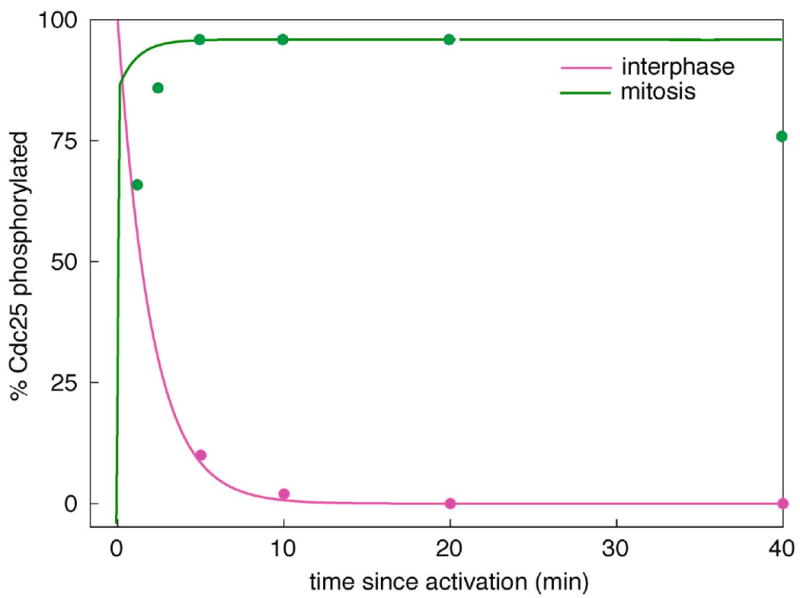
Simulations (lines) are compared to experimental data (circles) estimated from Kumagai et al. 1992, Figure 10. The phosphorylation of Cdc25 during M phase was monitored by gel-shift of endogenous Cdc25, and the dephosphorylation of Cdc25 during interphase was monitored by loss of 32P from radioactively phosphorylated, exogenous Cdc25 added to an extract. The theoretical curves were computed from the full model (Table 2) and the final parameter set (Table 3). Assumptions: [MPF] = 100 nM in M phase; = 0 in interphase.