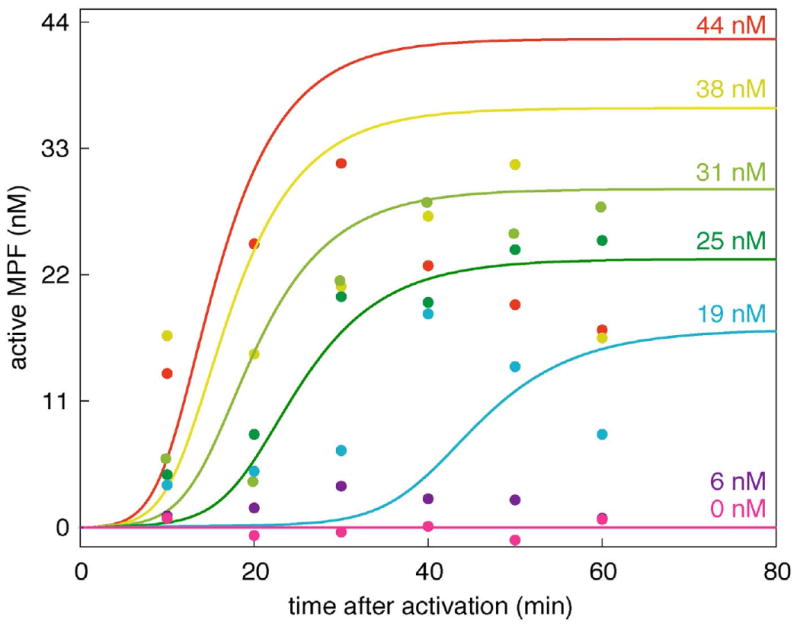
Figure 8. Simulations of critical slowing down in frog egg extracts.

Simulations (lines) are compared to experimental measurements (data points) of MPF activity vs. time at several cyclin concentrations approaching the activation threshold from above. The data points are from (Sha et al., 2003) as well as unpublished data (Sha and Sible) collected during the same experiment at 25 and 38 nM cyclin. The theoretical curves were computed from the full model (Table 2) and the final parameter set (Table 3).
