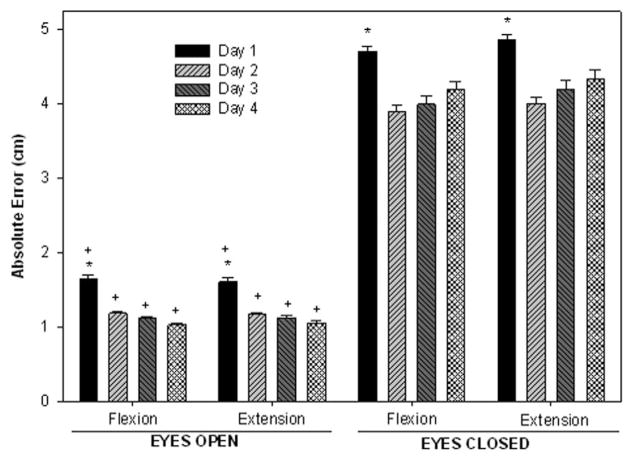
Figure 4.
Mean absolute error during the flexion and extension phases of the SLS task in the EO and EC conditions. The vertical bars represent the average errors over days 1, 2, 3, and 4. The y axis represents absolute error of performance in centimeters. *Indicates significant difference from other days when conditions are combined. +Indicates significant difference from EC when days are combined.

