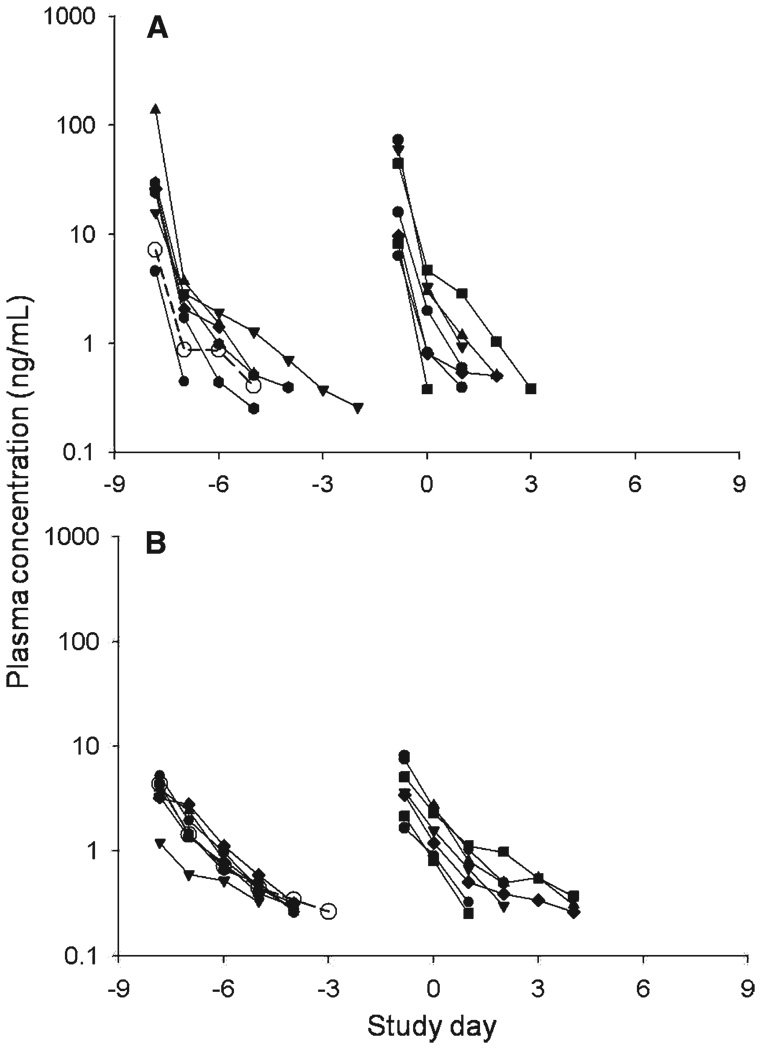
FIGURE 4.
Plasma concentration-time profiles of pafuramidine (A) and its active metabolite DB75 (B). For each panel, curves on the left represent the day −8 treatment arm and those on the right represent the day −1 treatment arm. Samples with plasma levels < 0.25 ng/mL are not plotted. Open symbols = subject in day −8 treatment group in whom malaria did not develop.

