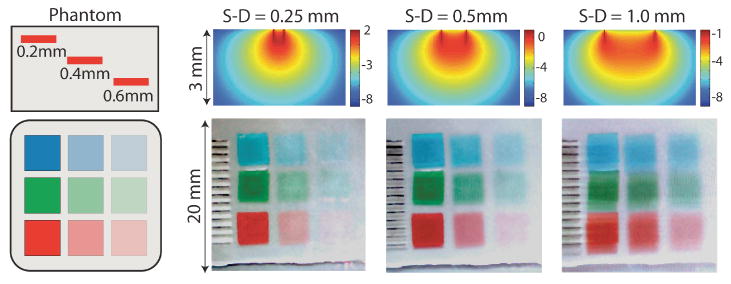
Figure 4.

(online color at: www.lpr-journal.org) LOT Raw data and sensitivity functions. (top) Simulated sensitivity functions for LOT showing the log(sensitivity) of a change in measurement ΔM to a change in absorption Δμa for three source-detector separations. Images below show raw LOT data acquired using the same source-detector separations on a multicolor, multilayered phantom. All three colors were acquired simultaneously and data is shown as a red-green-blue merged bitmap. For the narrowest source-detector separation, the most superficial absorbing regions have the darkest contrast, and the deepest absorbers can barely be seen. For the wider separation, the deeper absorbers have more contrast. Lines to the left are millimeter ruler makings. Note also the shadow on these lines and the objects for the wider source-detector separations. The phantom was composed of colored acetate squares embedded in a homogenous background medium consisting of agarose, intralipid, and bovine hemoglobin. The optical properties of the background medium were: μa = 0.2 mm−1 and at 532 nm, while the red, green and blue squares had μa values of 5.3, 1.2, and 0.9 mm−1 at 532 nm, respectively. Figure modified from [37]
