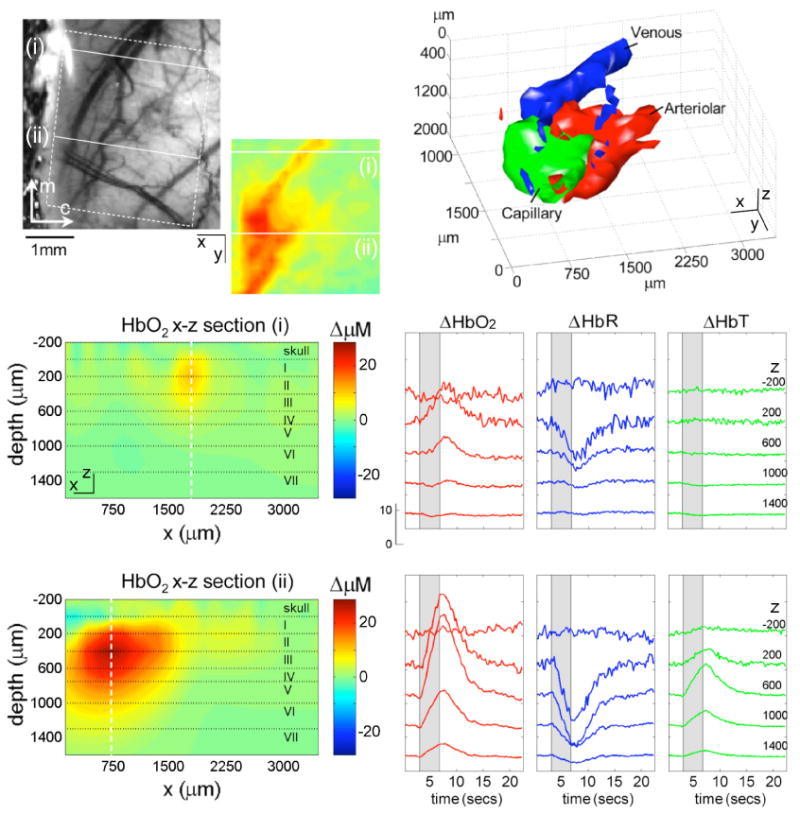
Figure 6.

(online color at: www.lpr-journal.org) Laminar Optical Tomography of the cortical hemodynamic response to forepaw stimulus in rat. (top left) photograph of field of view showing superficial veins and dural vessels (the skull was thinned but intact). Inset: reconstructed x–y LOT image of HbO2 response at 200 micron depth at 0.6 secs after cessation of 4 second stimulus. Below: x–z planes of the same 3D HbO2 reconstruction showing a cross-section through the surface vein (top, region i), and the deeper capillary response (bottom, region ii). Lower right: time-courses of hemodynamic response at each depth for the center of the surface vein (top) and the capillary response (bottom). Top right: isosurface rendering of hemodynamic response resolved into arterial, capillary and venous compartments based on their distinctive temporal behaviors. Modified from [14].
