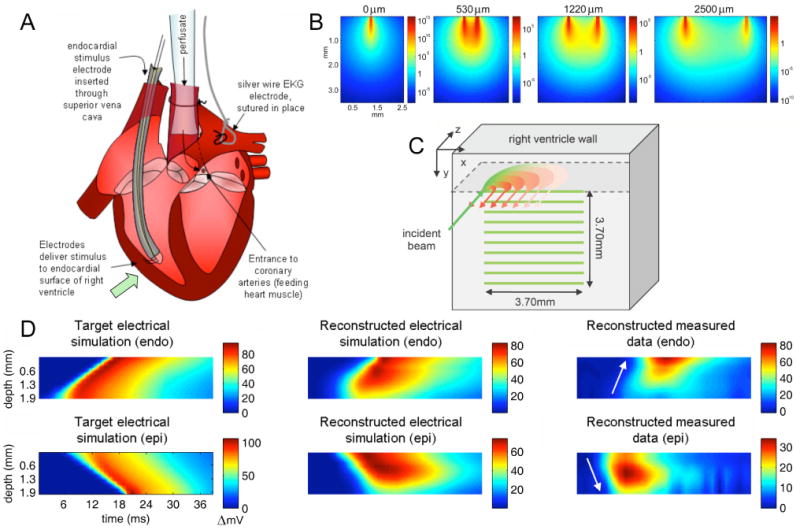
Figure 8.

(online color at: www.lpr-journal.org) Laminar Optical Tomography of Voltage Sensitive Dyes in perfused rat heart. A) The rat heart was cannulated and Langendorf perfused. An electrode was positioned within the right ventricle, LOT imaging was performed on the outer wall of the right ventricle. B) Sensitivity functions (log scale) for fluorescent voltage sensitive emission are asymmetrical owing to the different optical properties experienced by incident and detected light. C) Data was acquired in the form of serial x-direction line-scans as illustrated. D) Results are shown as average signal plotted as a function of depth and time. Left: Data simulated with a model of electrical propagation shows wave traveling from endo-cardial to epi-cardial surface (top) or epi-cardial to endo-cardial surface (bottom). Center: Reconstructed results using LOT forward model and reconstruction of simulated electrical propagation data. Signal is distorted for deeper layers, but direction and speed of propagation can be discerned. Right: Reconstructions of measured data for endo and epi-cardial stimulation. Direction of propagation can be determined. Figure modified from [15].
