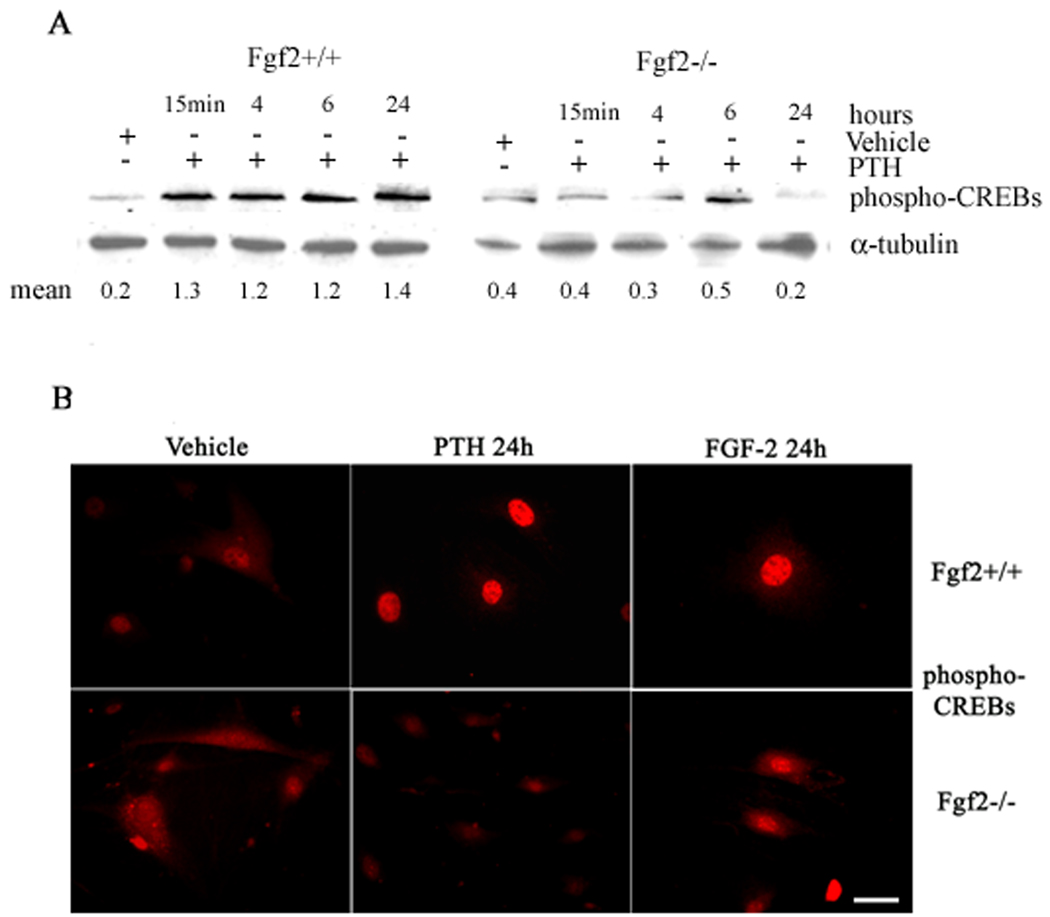
Fig. 3. Effect of PTH on phospho-CREBs in COBs from Fgf2+/+ and Fgf2−/− mice.
A, Expression levels of phospho-CREBs in COBs were analyzed by Western blotting as described under methods. COBs from Fgf2+/+ and Fgf2−/− were treated with PTH 10−9 M from 15 min to 24 h. Proteins (5 µg) from each sample were subjected to SDS–PAGE, transferred to PVDF membrane and probed with a polyclonal anti-phospho-CREBs antibody. Filters were stripped and reprobed with a monoclonal anti-α-tubulin antibody to show equal amount of loading. B, Localization of phospho-CREBs in COBs was analyzed by fluorescent microscopy using a polyclonal anti-phospho-CREBs antibody, as described under methods (green: FITC staining). Bar, 50 µm.

