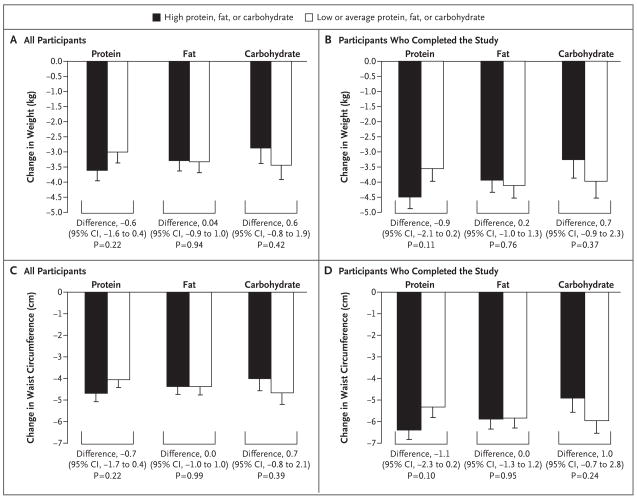
Figure 1. Mean Change in Body Weight and Waist Circumference from Baseline to 2 Years According to Dietary Macronutrient Content.
Solid bars represent high-protein, high-fat, or highest-carbohydrate diets. Open bars represent average-protein, low-fat, or lowest-carbohydrate diets. T bars indicate standard errors. Panels A and C show the change in body weight and the change in waist circumference, respectively, for all participants who were randomly assigned to a diet (a total of 811); missing data were imputed. A total of 403 participants were assigned to a high-protein diet and 408 to an average-protein diet, 405 were assigned to a high-fat diet and 406 to a low-fat diet, and 204 were assigned to the highest-carbohydrate diet and 201 to the lowest-carbohydrate diet. Panel B shows the change in body weight for the 645 participants who provided measurements at 2 years. Of these participants, 325 were assigned to a high-protein diet and 320 to an average-protein diet, 319 were assigned to a high-fat diet and 326 to a low-fat diet, and 169 were assigned to the highest-carbohydrate diet and 168 to the lowest-carbohydrate diet. Panel D shows the change in waist circumference for the 599 participants who provided measurements at 2 years. Of these participants, 303 were assigned to a high-protein diet and 296 to an average-protein diet, 292 were assigned to a high-fat diet and 307 to a low-fat diet, and 159 were assigned to the highest-carbohydrate diet and 155 to the lowest-carbohydrate diet.

