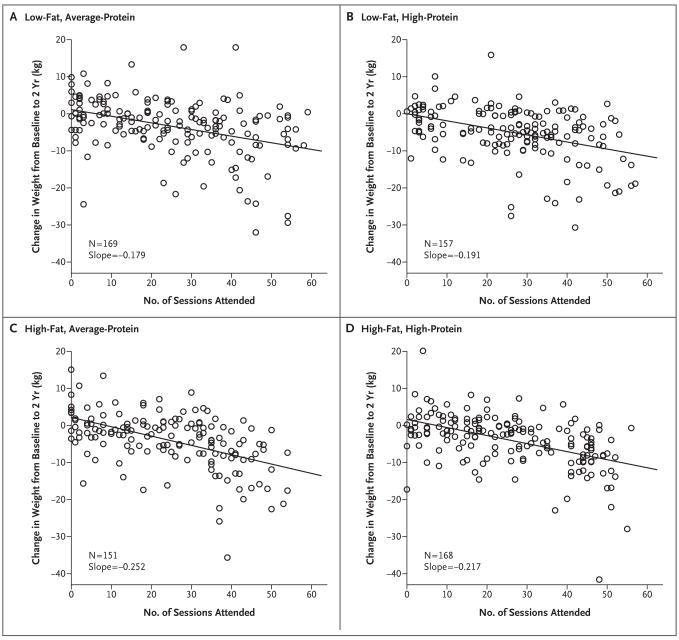
Figure 3. Change in Body Weight from Baseline to 2 Years According to Attendance at Counseling Sessions for Weight Loss, among the 645 Participants Who Completed the Study.
Panel A shows data for the low-fat, average-protein group; Panel B, for the low-fat, high-protein group; Panel C, for the high-fat, average-protein group; and Panel D, for the high-fat, high-protein group. There were no significant differences among the regression coefficients (P>0.2 for all comparisons; R2 = 0.2 for total cohort).

