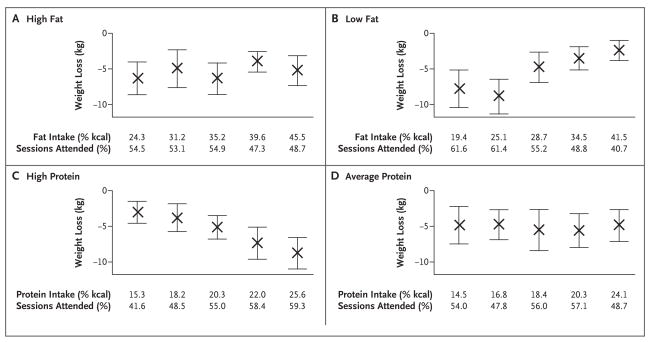
Figure 4. Weight Loss at 2 Years According to Adherence to Dietary Fat and Protein Goals.
Intake was determined from three 24-hour diet recalls. Quintiles of fat and protein intakes are shown for the combined high-fat groups (Panel A), low-fat groups (Panel B), high-protein groups (Panel C), and average-protein groups (Panel D); there were 45 to 51 participants per quintile. Rates of attendance at group sessions (percent of total sessions attended over the 2-year period) are shown for the quintiles of fat and protein intake. I bars indicate 95% confidence intervals. P values for a trend in weight loss across quintiles are as follows: P<0.001 for fat intake in low-fat groups, P<0.001 for protein intake in high-protein groups, P = 0.36 for fat intake in high-fat groups, and P = 0.83 for protein intake in average-protein groups. The results were similar when determined within each of the four diet groups (data not shown).

