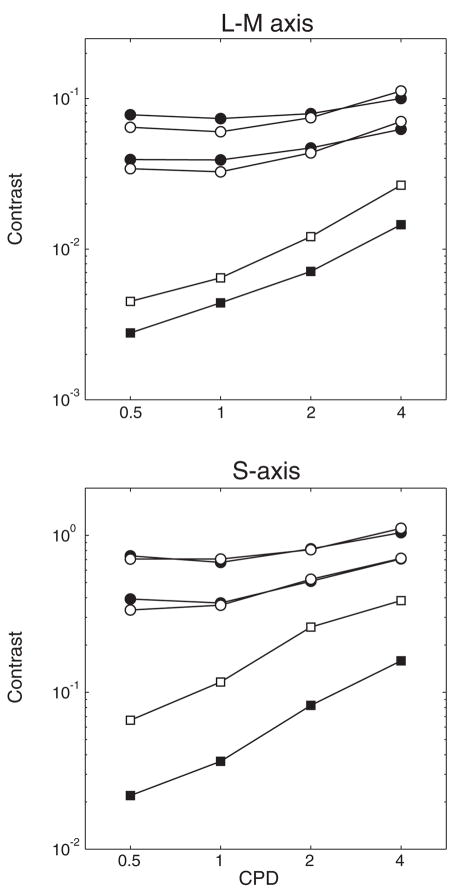
Fig. 6.
Contrast threshold sensitivity functions (squares) and contrast matching functions (circles) are plotted for younger subjects (filled symbols) and older subjects (open symbols). These data are from two studies that used different methodologies as described in the text. However, S-axis thresholds were obtained in both studies for a 2 cpd stimulus, and the CMFs were scaled based on a comparison of these thresholds. [Data from Hardy, Delahunt, Okajima and Werner65 and Delahunt, Hardy, Okajima and Werner72].

