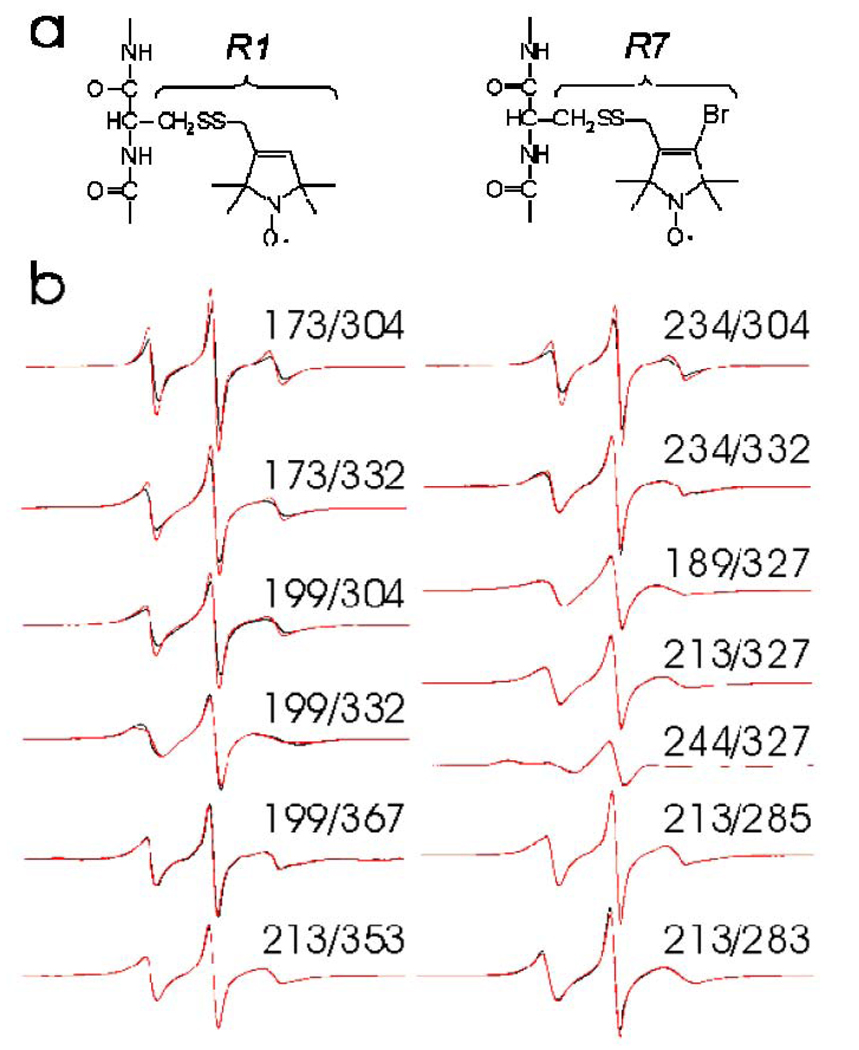
Figure 2. EPR spectra from syt1C2AB.
(a) R1 and R7 spin-labeled side chains that are obtained by derivatization of cysteine mutants of syt1C2AB. (b) X-band EPR spectra of thirteen R1 double labeled mutants of syt1C2AB where one label is in C2A and a second is in C2B. The black traces are spectra recorded in the presence of excess Ca2+ (1 mM) and the red traces are spectra recorded in the Ca2+-free state.

