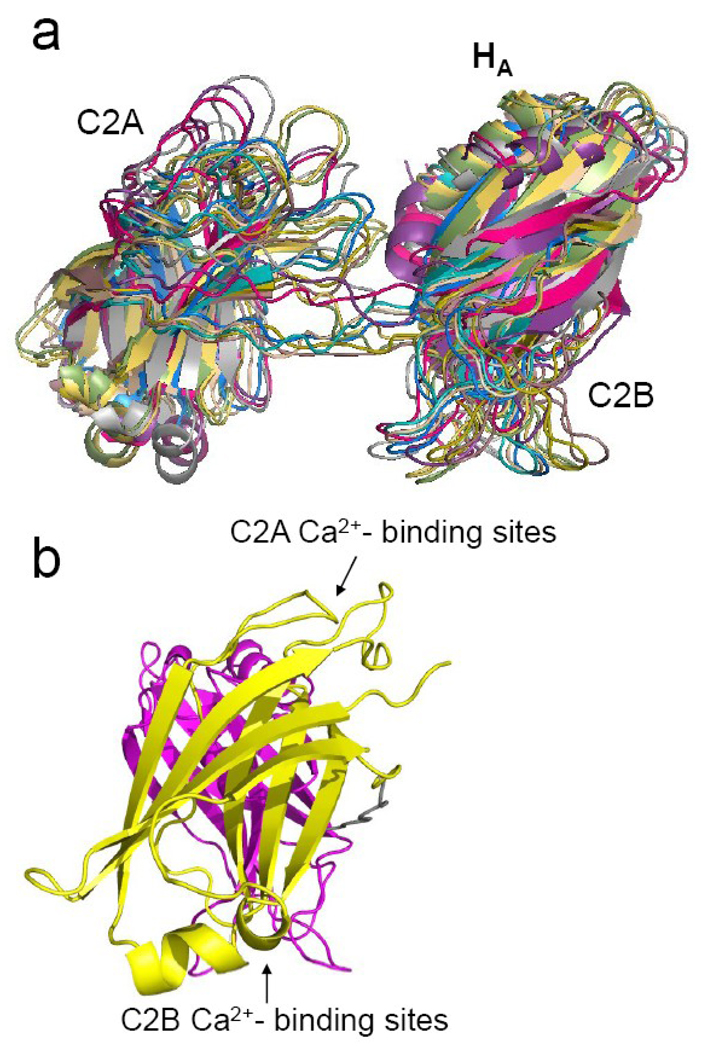
Figure 4. Solution structures of syt1C2AB with Ca2+ obtained by simulated annealing.
(a) An alignment of the 10 lowest energy structures from the simulated annealing incorporating the distance restraints in Table 1 with Xplor-NIH and allowing the region linking C2A and C2B (residues 266 to 272) to be flexible 36. The RMSD for these aligned structures is approximately 5.0 Angstroms. (b) Average of the 20 lowest energy structures shown end on (C2A is in yellow, C2B in magenta). The β-sheet regions of both domains are not perfectly co-linear but are tilted by about 70 degrees.

