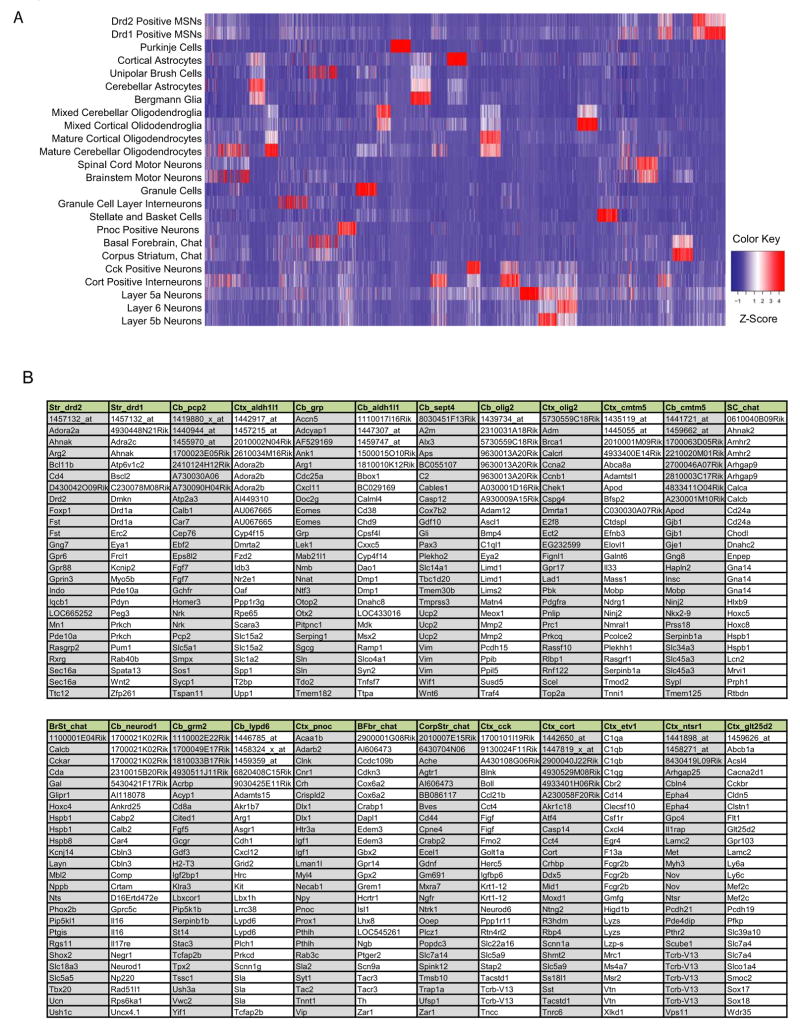
Figure 6. Comparative BACarray analysis reveals cell type specific translational profiles.
A) Heatmap showing the normalized expression of the 100 top ranked probesets from each sample, across all samples. Note blocks of genes detected as specific to each cell type (such as Pcp2). Related cell types are evidenced by co-expression of some of these genes (such as Bergman glia, and cerebellar astrocytes). B) Lists of the top 25 probesets of the 100 for each cell population from A include many known cell specific genes (for example Pcp2 and Calb1 in Purkinje cells), as well as a variety of novel genes and probesets (such as 2410124H12Rik). Columns are headed with the tissue source (Striatum: Str; Cerebellum: Cb; Cortex: Ctx; Spinal Cord: SC; Brain Stem: BrSt; Basal Forebrain: BF; and Corpus Striatum: CorpStr) as well as the appropriate BACarray driver. Column order corresponds to cell type order in A.

