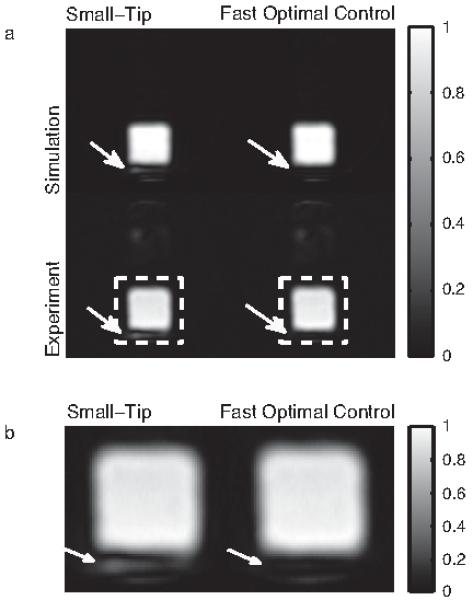
Fig. 12.

a) Simulation and experimental results. In both the simulation and experiment, a spike is present in the pattern excited by the small-tip-designed pulses that is suppressed by the fast optimal control method (indicated by arrows). The fast optimal control method also corrected a distortion in the lower left hand corner of the excited square. (b) Zoomed regions indicated by the dashed white boxes in (a).
