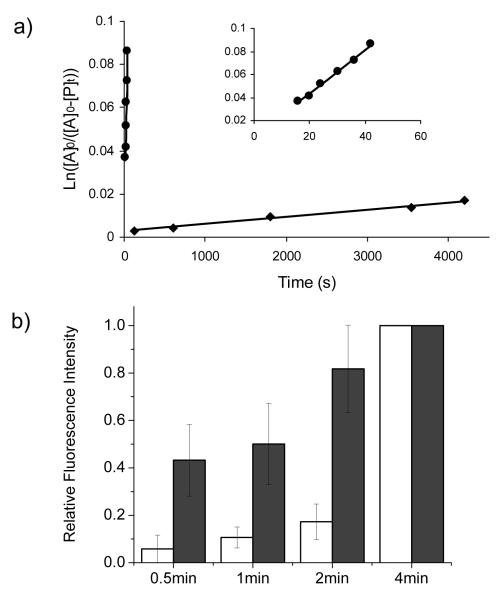
Figure 2.
(a) Kinetic study of the cycloaddition reactions between allyl phenyl ether and tetrazole 1 (◆) and 10 (●), respectively. A close-up view of the tetrazole 10 kinetics was rendered in the insert; (b) Kinetic study of the alkene-Z labeling by either tetrazole 1 (open bar) or 10 (filled bar). The fluorescent intensities at 4 min were treated as 100% for each reaction and used in deriving the relative intensities. The concentrations of alkene-Z and tetrazoles were 10 μM and 200 μM, respectively. Error bars represent the standard deviations from three independent measurements.

