
Figure 2.
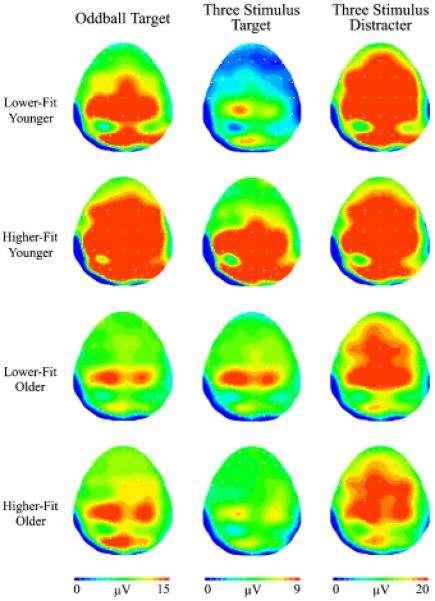
Topographic amplitude maps for the P3a and P3b components for each age and fitness from each stimulus condition. Note different voltage scales for each task.
Official websites use .gov
A
.gov website belongs to an official
government organization in the United States.
Secure .gov websites use HTTPS
A lock (
) or https:// means you've safely
connected to the .gov website. Share sensitive
information only on official, secure websites.
Topographic amplitude maps for the P3a and P3b components for each age and fitness from each stimulus condition. Note different voltage scales for each task.