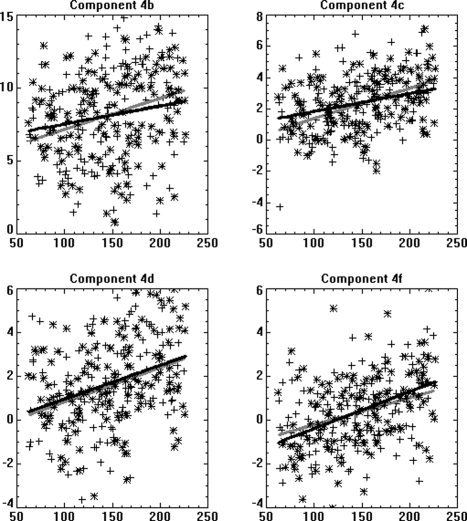
Figure 7.

Scatterplots of the goodness‐of‐fit parameters (T‐scores) of regression of the associated IC time courses from each subject to the reference time course found from the data‐driven developmental ICA analyses components for the components displayed in Figures 4b,c,d, and f (Y axis) as a function of subject age in months (X axis); effects of task performance were removed via stepwise regression. Legend: Boys = plus signs, gray line; Girls = asterisks; black line.
