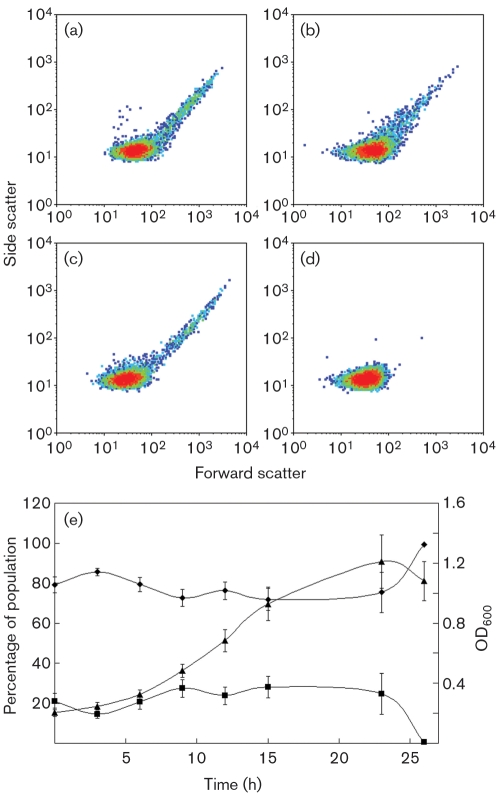
Fig. 4.
Side scatter versus forward scatter distributions for succinate-grown (a and b) and methanol-grown (c and d) cells in exponential phase (a and c) and stationary phase (b and d). (e) Distributions throughout a growth curve for methanol-grown cells; ⧫, non-gated region; ▪, gated region; ▴, OD600. Means±sd are plotted (n=12).

