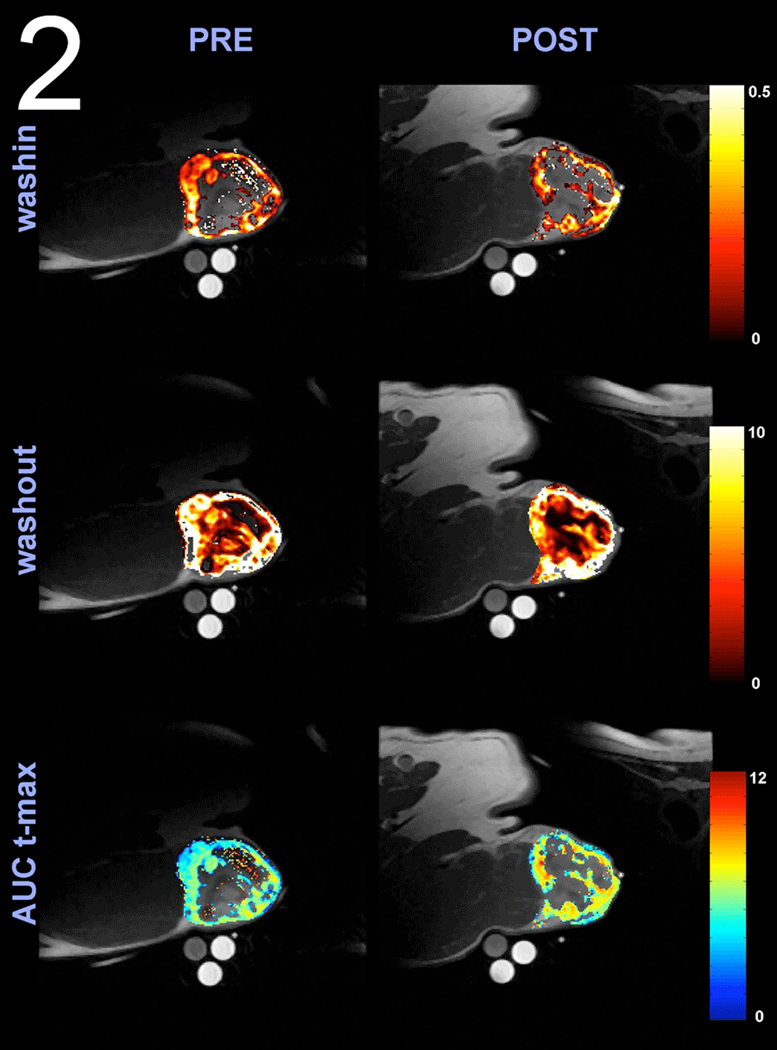
Figure 2.
Overlay of anatomical T1 images with washin, washout, and AUC t-max perfusion maps obtained from a canine patient with a hemangiopercytoma of the perineum using DCE-MRI. Note the heterogeneity in tumor perfusion and the increase in AUC t-max post 24 hour post hyperthermia. AUC t-max is the Area Under the Curve of the dynamic signal enhancement between 0 and the time of maximal muscle enhancement. AUC values are expressed in Log10.

