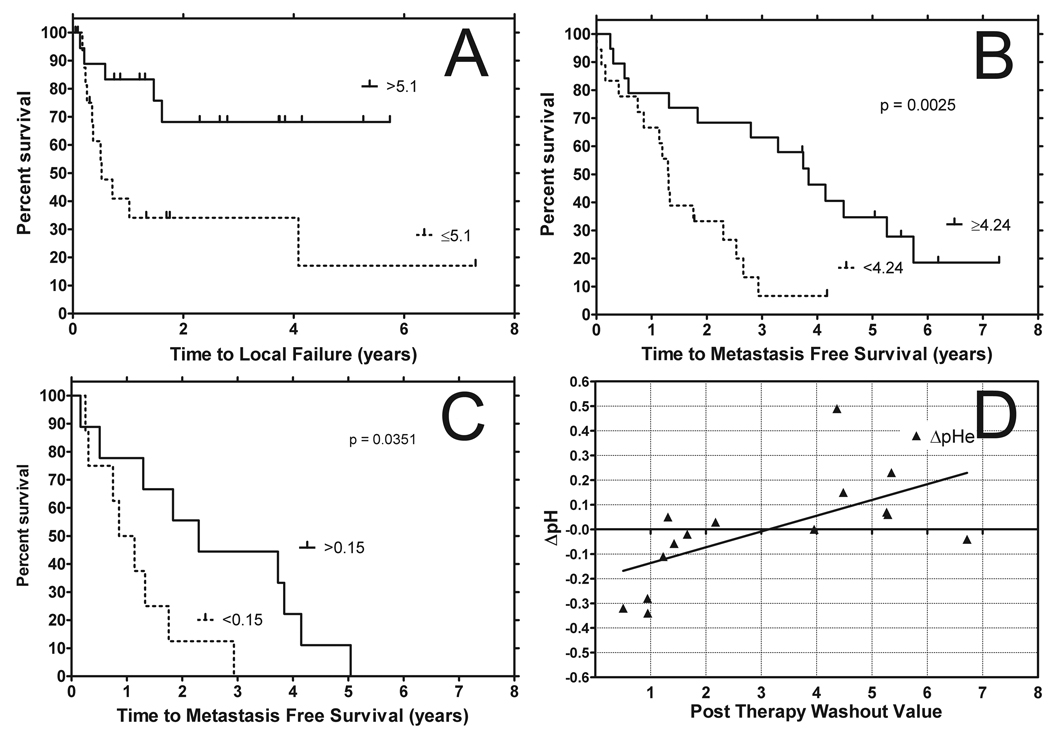
Figure 3.
(a) Kaplan Meier plot depicting time to local failure for tumors with AUC t-max values (expressed in Log10 form) above and below their cut point values. (cut point = Interquartile range/2). Kaplan Meier plot depicting metastasis free survival for tumors with washout values above and below their cut point values (cut point = Interquartile range/2) before treatment (b) and washin 24 hours post hyperthermia with a similarly calculated cut point (c). Relationship of pHi-Pre and pHe@24hr - pHe-Pre versus washout measured with DCE-MRI (d). Interstitial pH prior to therapy shows a negative correlation with increasing post washout values. Changes in extracellular pH from therapy show a positive correlation with increase post washout values. This suggests that following therapy the ability to remove the contrast agent results is greater ability to also remove acid from the extracellular environment of tumors that are more acidic prior to therapy. This agrees with the assumption that hyperthermia improves perfusion and removal of the contrast agent is suggestive of this.

