Figure 3.
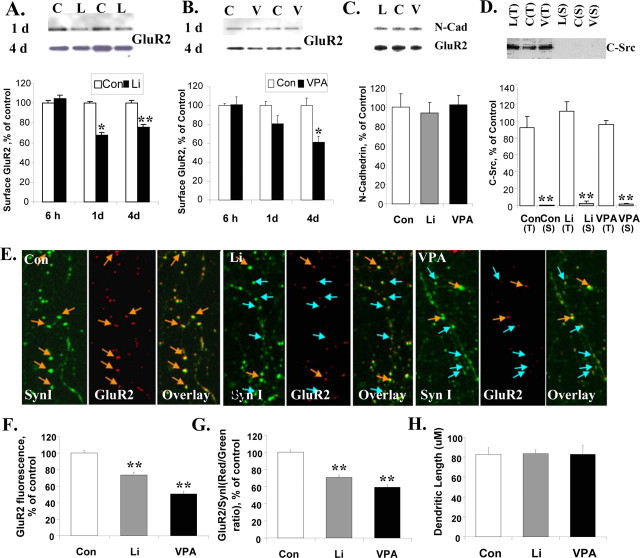
Surface and synaptic GluR2 levels in cultured hippocampal neurons are time-dependently decreased after treatment with lithium or VPA. Surface GluR2 levels were determined by biotinylation after treatment with lithium (L, Li; 1.0 mm) or VPA (V; 1.0 mm). Data were summarized from two to three independent experiments. For the immunostaining study, hippocampal neurons were double stained with anti-GluR2 (red) and anti-synapsin I (SynI; green) antibodies after lithium (1.0 mm) or VPA (1.0 mm) treatment for 4 d. The GluR2-positive synapses are indicated with yellow arrows, and GluR2-negative synapses are indicated with blue arrows. Data were combined from two to three independent experiments. C/Con, Control. A, The effects of lithium (1.0 mm) on surface GluR2 after 6 h, 1 d, or 4 d treatment (n = 5–7 for each condition; 1 d Con vs Li, *p = 0.011; 4 d Con vs Li, **p = 0.001; Student's t test). B, The effects of VPA (1.0 mm) on surface GluR2 after 6 h, 1 d, or 4 d treatment (n = 5–7; 4 d Con vs VPA, *p = 0.023; Student's t test). C, N-cadherin (N-Cad) remained unchanged in the surface protein fraction after lithium or VPA treatment (n = 6). D, C-Src, a cytosal marker, is absent in the surface (S) protein fraction and abundant in total protein (T) (n = 3–6; Student's t test, **p < 0.001). E, Double immunostaining of GluR2 and synapsin I indicated that GluR2 is attenuated at synapses. F, Quantification of GluR2 (red) fluorescent intensity at the synapses (n = 250–350 synapses for each group; one-way ANOVA, p < 0.001, Bonferroni's multiple comparison; Con vs Li, **p < 0.001; Con vs VPA, **p < 0.001). G, The GluR2 (red)/synapsin I (green) ratio at synapses of hippocampal neurons after lithium or VPA treatment (n = 250–350 synapses for each group; one-way ANOVA, p < 0.001, Bonferroni's multiple comparison; Con vs Li, **p < 0.001; Con vs VPA, **p < 0.001). H, Equal dendrite lengths were used for quantification in each treatment condition. Error bars indicate SE.

