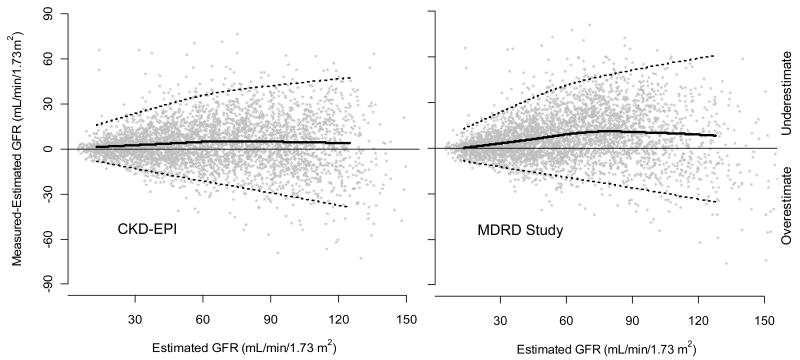
Figure 1. Comparison of performance of Modification of Diet in Renal Disease (MDRD) Study and Chronic Kidney Disease Epidemiology Collaboration (CKD-EPI) equations by estimated GFR in the external validation dataset.
Panel 1. Measured vs. estimated GFR. Panel 2. Difference between measured and estimated vs. estimated GFR. Shown are smoothed regression line and 95% CI (computed using the lowess smoothing function in R), using quantile regression, excluding lowest and highest 2.5% of estimated GFR values. To convert GFR from mL/min/1.73 m2 to mL/s/m2, multiply by 0.0167.

