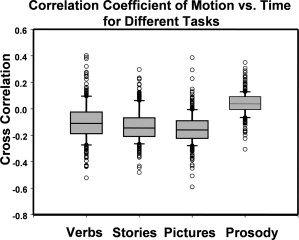
Figure 1.

Box plot of the correlation coefficient between head motion and task/control cycle in different fMRI tasks. The correlation coefficient was calculated between head motion versus the time course (the interleaved 30‐sec on‐period and 30‐sec off‐period). For all four tasks, this correlation is found to be very small for the majority of the subjects.
