
Figure 1.
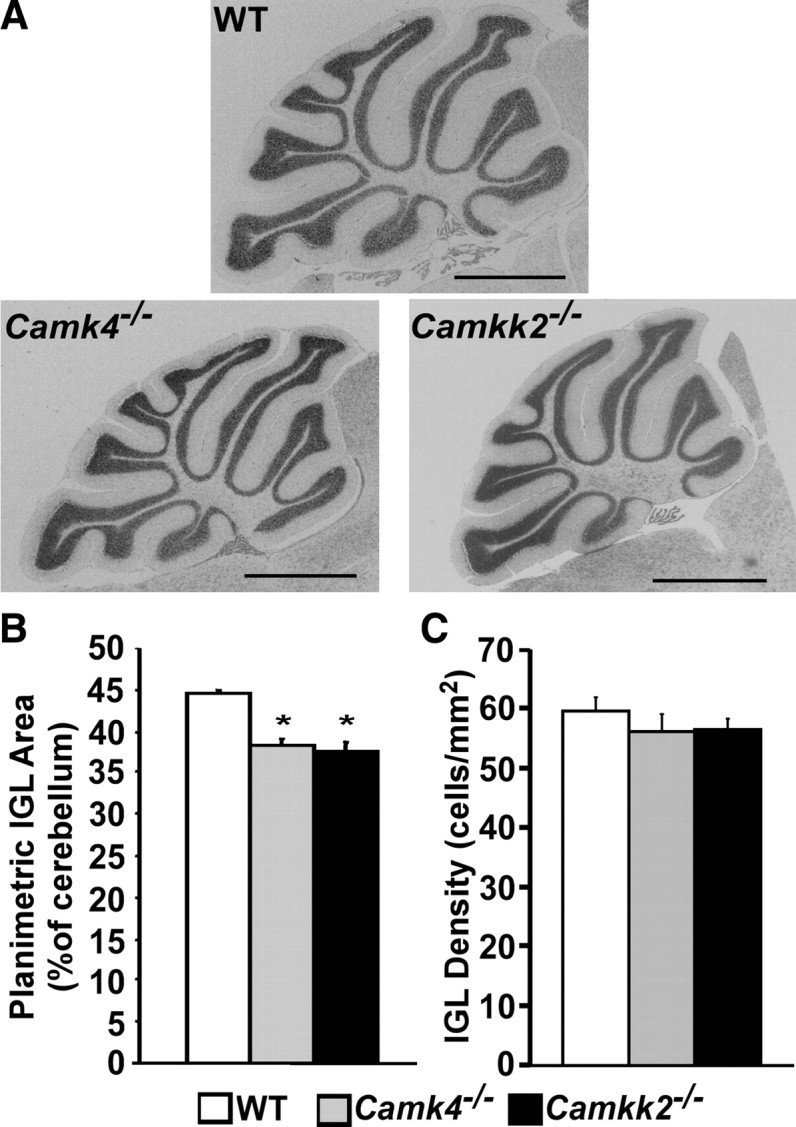
Planimetric analysis of the cerebellum from adult WT, Camk4−/−, and Camkk2−/− mice. A, Mid-sagittal cerebellar sections from 3-month-old WT, Camk4−/−, and Camkk2−/− mice were stained with cresyl violet and photographed at 1× magnification. Shown are representative cerebellar sections (scale bars, 1 mm). B, The percentage of the IGL cross-sectional area compared with the whole cerebellum was quantified as described in Materials and Methods. The percentage of the cerebellar cross-sectional area relegated to the IGL was decreased from 44.3% in the wild-type to 38.4% in the Camk4−/− and 37.5% in the Camkk2−/− mice. Values shown are mean ± SEM (*p < 0.01 for difference against WT; n = 5 for each genotype). C, Three-month-old Camk4−/− and Camkk2−/− mice show no difference in IGL cell density compared with WT (values shown are mean ± SEM; n = 5 for each genotype).