
Figure 2.
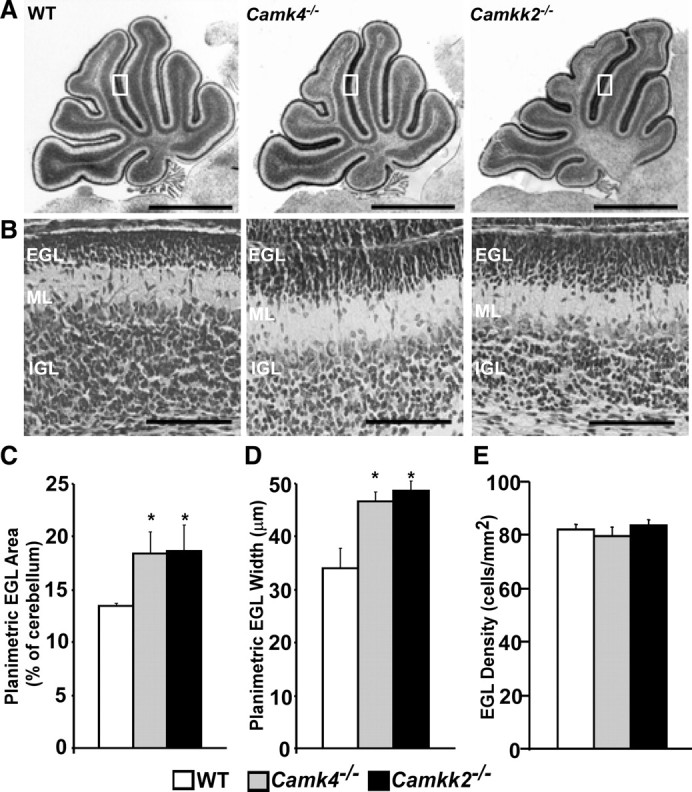
Structural analysis of the cerebellum from postnatal 7-d-old WT, Camk4−/−, and Camkk2−/− mice. A, Mid-sagittal sections from P7 WT, Camk4−/−, and Camkk2−/− mice were stained with cresyl violet and photographed at 1× magnification. Shown are representative cerebellar sections (scale bars, 1 mm). B, Representative sections of cerebella derived from P7 WT, Camk4−/−, and Camkk2−/− mice. Shown at 20× magnification is the mid-portion of the fifth folia. Note the abnormally thicker EGL in both Camk4−/− and Camkk2−/− mice (scale bars, 100 μm). C, The percentage of the EGL cross-sectional area compared with the whole cerebellum was quantified as described in Materials and Methods. The percentage of the cerebellar cross-sectional area relegated to the EGL was increased from 13.4% in the WT to 18.4% in the Camk4−/− and 18.6% in the Camkk2−/− mice. Values shown are mean ± SEM (*p < 0.01 for difference against WT; n = 5 for each genotype). D, Planimetric measurement of the EGL width shows a significant increase in the Camk4−/− and Camkk2−/− mice compared with WT. Values shown are mean ± SEM (*p < 0.05 for difference against WT; n = 5 for each genotype). E, Seven-day-old Camk4−/− and Camkk2−/− mice show no difference in EGL cell density compared with WT (values shown are mean ± SEM; n = 5 for each genotype).