
Figure 3.
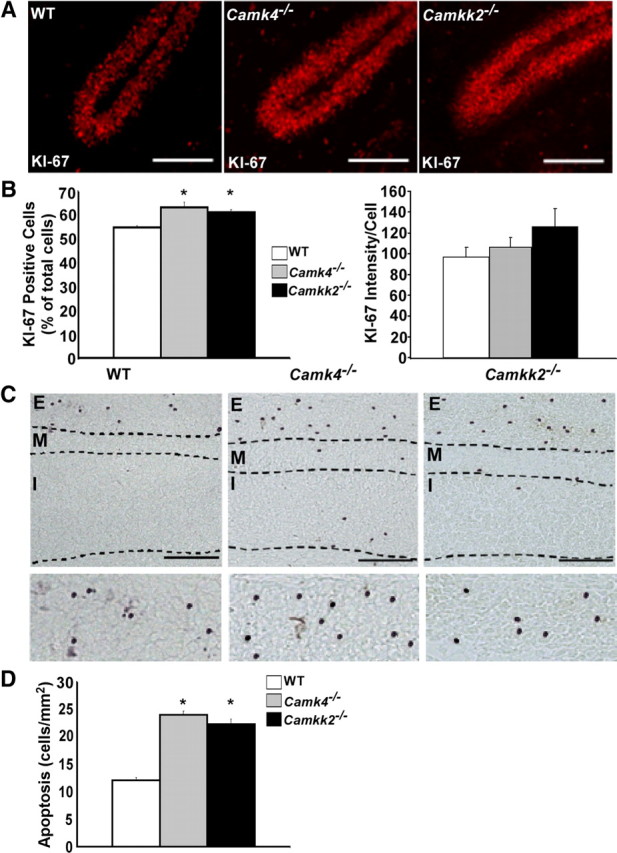
Camk4−/− and Camkk2−/− mice have increased cell proliferation and apoptosis in the EGL at postnatal day 7. A, Representative photograph showing the identification of proliferating cells after immunolabeling against the Ki-67 nuclear antigen. Note the relative increase in cells staining positive in the sections from both the Camk4−/− and Camkk2−/− mice (scale bars, 100 μm). B, The left panel shows the quantification of the total percentage of Ki-67-positive cells in the EGL area. The right panel shows that there was no difference in the average staining intensity of the cells, thus confirming the increase in proliferating cells from both null mice. Values shown are mean ± SEM (*p < 0.05 for difference against WT; p = 0.3 for difference in staining intensity; n = 4 for each genotype). C, The top is a representative photograph of apoptotic GCPs in wild-type, Camk4−/−, and Camkk2−/− mice identified by Tunnel staining (scale bars, 50 μm). The bottom is a higher magnification to demonstrate that the nuclei are indeed positively stained. D, Quantification showing an increase in the number of TUNEL-positive cells per square millimeter in the EGL of Camk4−/− and Camkk2−/− mice compared with WT. Values shown are mean ± SEM (*p < 0.01 for difference against WT; n = 4 for each genotype).