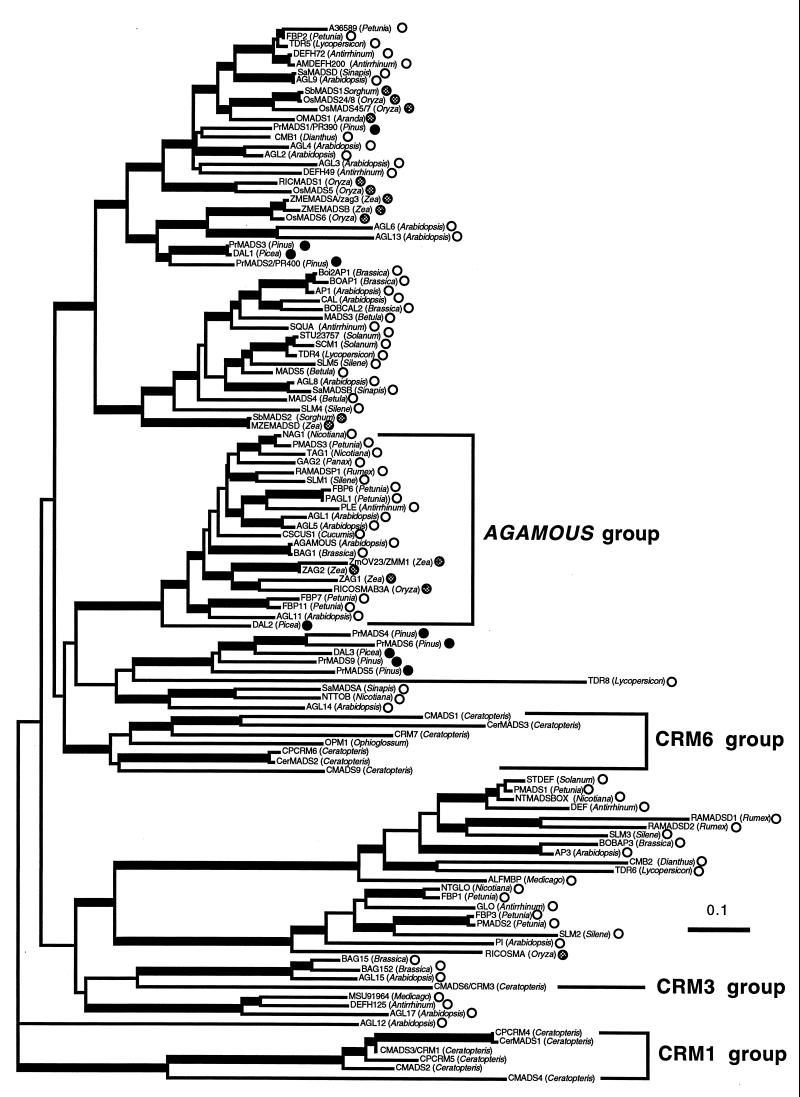
Figure 3.
A gene tree of plant MADS genes based on the neighbor-joining method (20). The horizontal branch length is proportional to the estimated number of amino acids substitutions per residue. (Bar = 0.1 aa substitution per residue.) Internal branches with more than 50% bootstrap values in 100 bootstrap replicates performed by using the seqboot program (19) are indicated as broader lines. This is an unrooted tree. The symbols after the gene names indicate the dicots (open circles), monocots (hatched circles), or gymnosperms (solid circles). Three Ceratopteris MADS gene groups and the monophyletic AGAMOUS group (8–10) are indicated by brackets.

