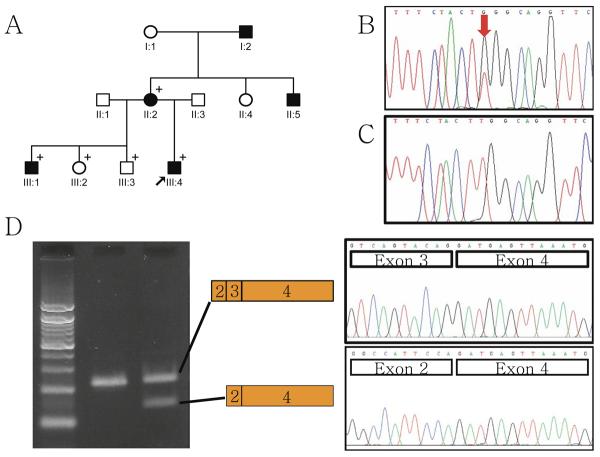
Figure 1.
Pedigree and mutational analyses of the kindred. (A) Pedigree of the kindred. Black arrow indicates proband. A + identifies members recruited in this study. (B) DNA sequencing chromatogram of the affected individual III-4. Red arrow indicates the position of the mutation. (C) DNA sequencing chromatogram of the unaffected individual III-3. (D) Agarose gel image of in vitro splicing assay. Left lane is DNA size marker. Middle lane is a result of pSPL3 vector with normal insert. Right lane is a result of pSPL3 vector with mutated insert. Upper band in the right lane is normally spliced mRNA transcript, and lower band is abnormally spliced mRNA with exon 3 deletion.

