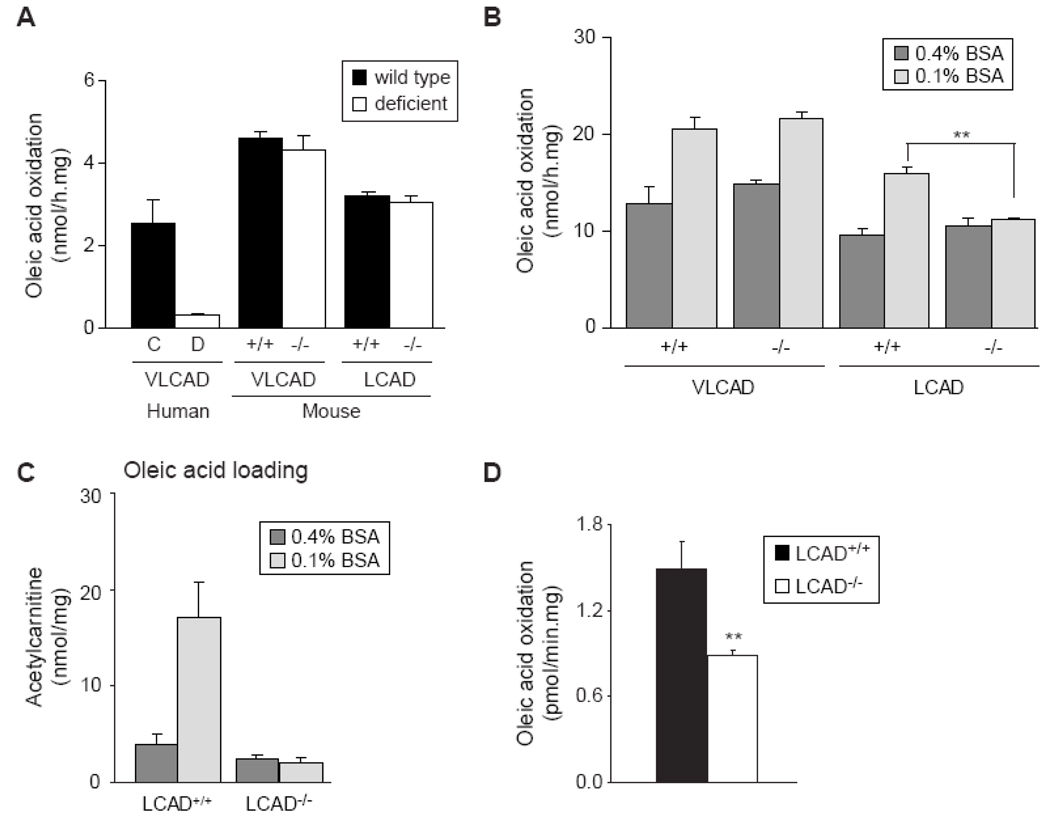
Figure 4.
Differences in oleic acid oxidation between human and mouse fibroblasts. A. Oleic acid oxidation in human VLCADD fibroblasts (D, white bar) compared to control fibroblasts (C, black bar), and VLCAD−/− and LCAD−/− mouse fibroblasts (white bars) compared to wild type fibroblasts (black bars), using 0.4% BSA and 100µM oleic acid. B. Oleic acid oxidation measured with 0.4% BSA and 0.1% BSA in fibroblasts of the VLCAD−/− and CAD−/− mouse compared with wild type fibroblasts. Differences between 0.1% and 0.4% treated cells were analyzed by a paired t test, ** denotes P < 0.01. C. C2-acylcarnitine production in fibroblasts of the LCAD−/− and wild type fibroblasts after 72 hr incubation with 100µM [U-13C]-oleic acid, in the presence of 0.4% BSA and 0.1% BSA. D. Oleic acid oxidation in soleus muscle of LCAD+/+ and LCAD−/− mice measured using 0.1% BSA and 100mM fatty acid. Differences were analyzed by an unpaired t test. ** denotes P < 0.01.

